- Home >
- Stock Photos >
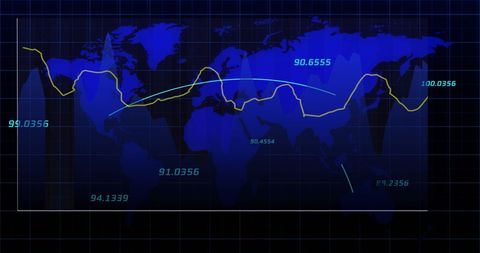
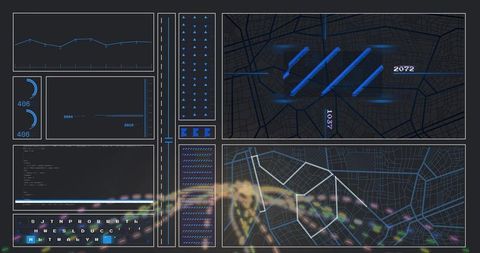
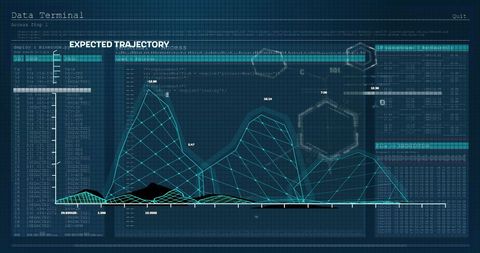
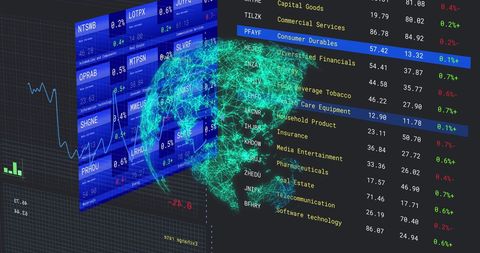
- Digital Interface Displaying Complex Data Network Connections
Digital Interface Displaying Complex Data Network Connections Image
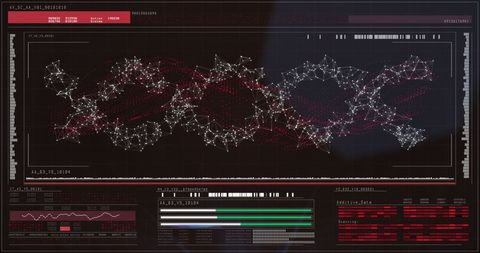
A sophisticated digital interface brimming with complex data patterns and interconnected network connections is seen in this image. Ideal for depicting modern technology and data analytics concepts. Useful for illustrating themes linked to innovation, information processing, and futuristic technology in digital content, presentations, and articles.

downloads
Tags:
More
Credit Photo
If you would like to credit the Photo, here are some ways you can do so
Text Link
photo Link
<span class="text-link">
<span>
<a target="_blank" href=https://pikwizard.com/photo/digital-interface-displaying-complex-data-network-connections/440221a6f7131f46f3157c809e1412ef/>PikWizard</a>
</span>
</span>
<span class="image-link">
<span
style="margin: 0 0 20px 0; display: inline-block; vertical-align: middle; width: 100%;"
>
<a
target="_blank"
href="https://pikwizard.com/photo/digital-interface-displaying-complex-data-network-connections/440221a6f7131f46f3157c809e1412ef/"
style="text-decoration: none; font-size: 10px; margin: 0;"
>
<img src="https://pikwizard.com/pw/medium/440221a6f7131f46f3157c809e1412ef.jpg" style="margin: 0; width: 100%;" alt="" />
<p style="font-size: 12px; margin: 0;">PikWizard</p>
</a>
</span>
</span>
Free (free of charge)
Free for personal and commercial use.
Author: Creative Art