- Home >
- Stock Photos >
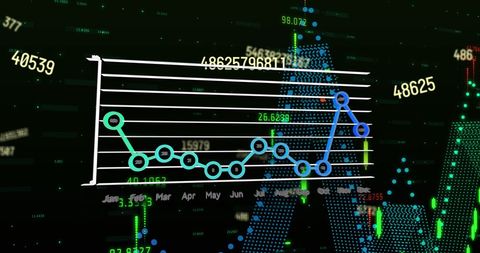
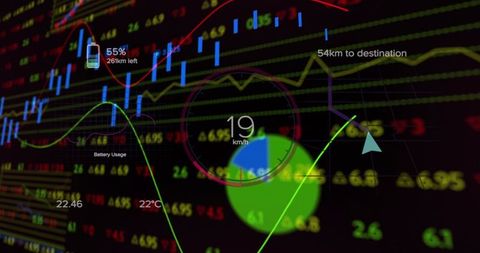
- Digital Interface Displaying COVID-19 Statistics Analysis and Trends
Digital Interface Displaying COVID-19 Statistics Analysis and Trends Image

Digital interface presents dynamic display of COVID-19 statistics tied to global business impacts. Floating cells suggest pandemic relevance, highlighting intersections with economic data analysis. Useful for presentations on pandemic economic effects, digital data analysis projects, or health economics documents.

downloads
Tags:
More
Credit Photo
If you would like to credit the Photo, here are some ways you can do so
Text Link
photo Link
<span class="text-link">
<span>
<a target="_blank" href=https://pikwizard.com/photo/digital-interface-displaying-covid-19-statistics-analysis-and-trends/f03d1f43512c27ecac3c3aae0d04bb33/>PikWizard</a>
</span>
</span>
<span class="image-link">
<span
style="margin: 0 0 20px 0; display: inline-block; vertical-align: middle; width: 100%;"
>
<a
target="_blank"
href="https://pikwizard.com/photo/digital-interface-displaying-covid-19-statistics-analysis-and-trends/f03d1f43512c27ecac3c3aae0d04bb33/"
style="text-decoration: none; font-size: 10px; margin: 0;"
>
<img src="https://pikwizard.com/pw/medium/f03d1f43512c27ecac3c3aae0d04bb33.jpg" style="margin: 0; width: 100%;" alt="" />
<p style="font-size: 12px; margin: 0;">PikWizard</p>
</a>
</span>
</span>
Free (free of charge)
Free for personal and commercial use.
Author: Creative Art