- Home >
- Stock Photos >
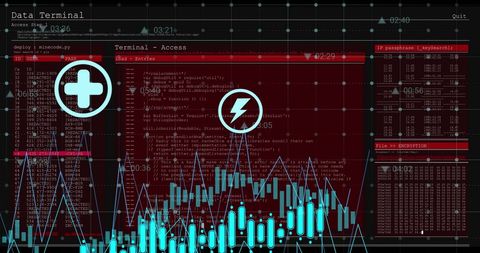
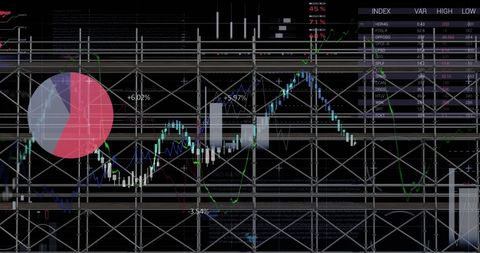
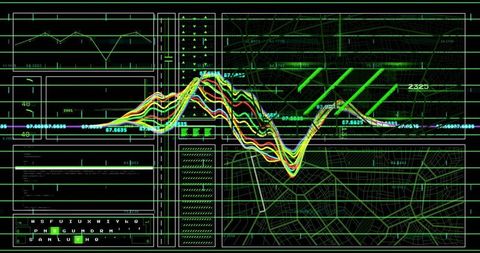
- Digital Interface Displaying Data Processing and Analytics Visuals
Digital Interface Displaying Data Processing and Analytics Visuals Image

Complex visuals showing interaction between digital data and business icons. Suitable for concepts related to technology, data analysis, and global connectivity. Ideal for articles or presentations on cyber networking and the impact of data processing in modern business.

downloads
Tags:
More
Credit Photo
If you would like to credit the Photo, here are some ways you can do so
Text Link
photo Link
<span class="text-link">
<span>
<a target="_blank" href=https://pikwizard.com/photo/digital-interface-displaying-data-processing-and-analytics-visuals/fc89802cd45ef429bf7e02fabe44b675/>PikWizard</a>
</span>
</span>
<span class="image-link">
<span
style="margin: 0 0 20px 0; display: inline-block; vertical-align: middle; width: 100%;"
>
<a
target="_blank"
href="https://pikwizard.com/photo/digital-interface-displaying-data-processing-and-analytics-visuals/fc89802cd45ef429bf7e02fabe44b675/"
style="text-decoration: none; font-size: 10px; margin: 0;"
>
<img src="https://pikwizard.com/pw/medium/fc89802cd45ef429bf7e02fabe44b675.jpg" style="margin: 0; width: 100%;" alt="" />
<p style="font-size: 12px; margin: 0;">PikWizard</p>
</a>
</span>
</span>
Free (free of charge)
Free for personal and commercial use.
Author: Awesome Content