- Home >
- Stock Photos >
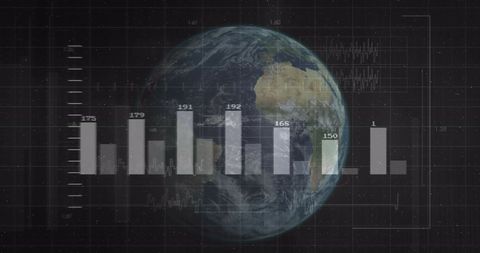
- Digital Interface Displaying Data Visualization Graphics
Digital Interface Displaying Data Visualization Graphics Image

Prone digital interface showing analytics using circular and bar charts with numeric labels. Useful for presentations on data science, technology solutions, and user interface design, as well as business or educational settings looking to depict advanced data analysis processes and visualization techniques.

downloads
Tags:
More
Credit Photo
If you would like to credit the Photo, here are some ways you can do so
Text Link
photo Link
<span class="text-link">
<span>
<a target="_blank" href=https://pikwizard.com/photo/digital-interface-displaying-data-visualization-graphics/19cee7a4504b6f215780353a14aac8db/>PikWizard</a>
</span>
</span>
<span class="image-link">
<span
style="margin: 0 0 20px 0; display: inline-block; vertical-align: middle; width: 100%;"
>
<a
target="_blank"
href="https://pikwizard.com/photo/digital-interface-displaying-data-visualization-graphics/19cee7a4504b6f215780353a14aac8db/"
style="text-decoration: none; font-size: 10px; margin: 0;"
>
<img src="https://pikwizard.com/pw/medium/19cee7a4504b6f215780353a14aac8db.jpg" style="margin: 0; width: 100%;" alt="" />
<p style="font-size: 12px; margin: 0;">PikWizard</p>
</a>
</span>
</span>
Free (free of charge)
Free for personal and commercial use.
Author: People Creations