- Home >
- Stock Photos >
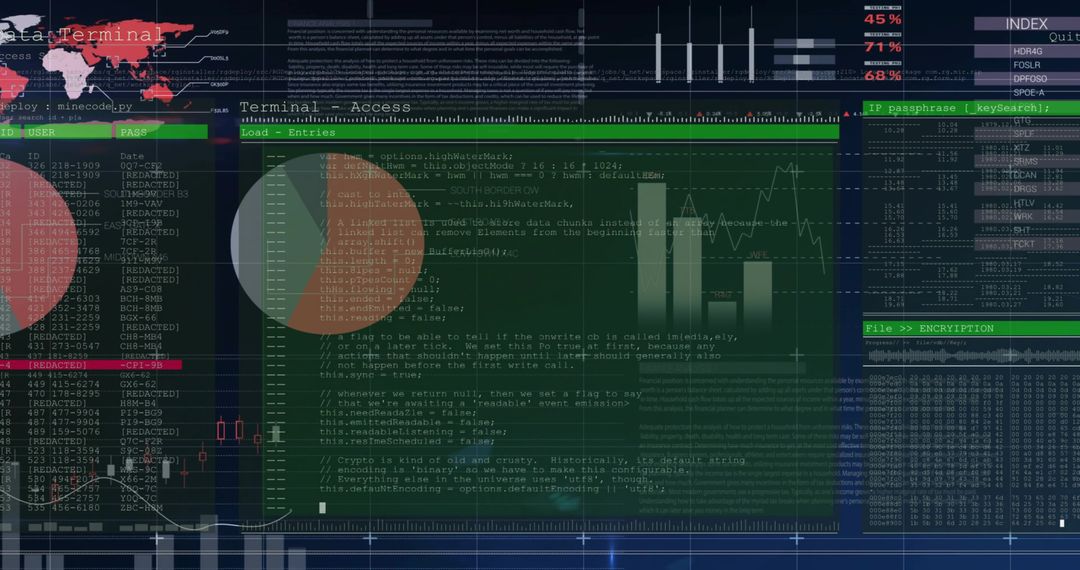
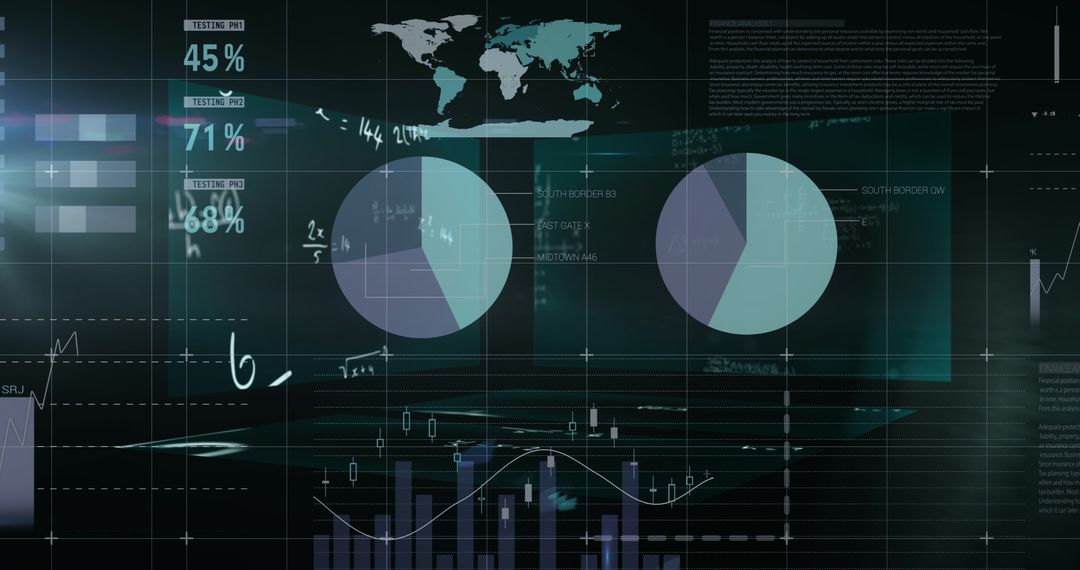
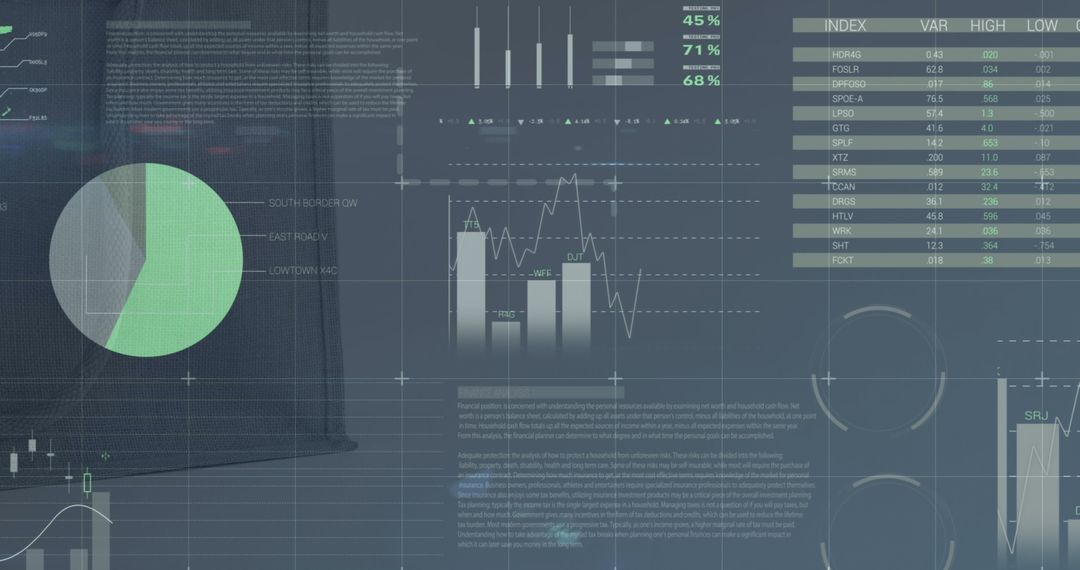
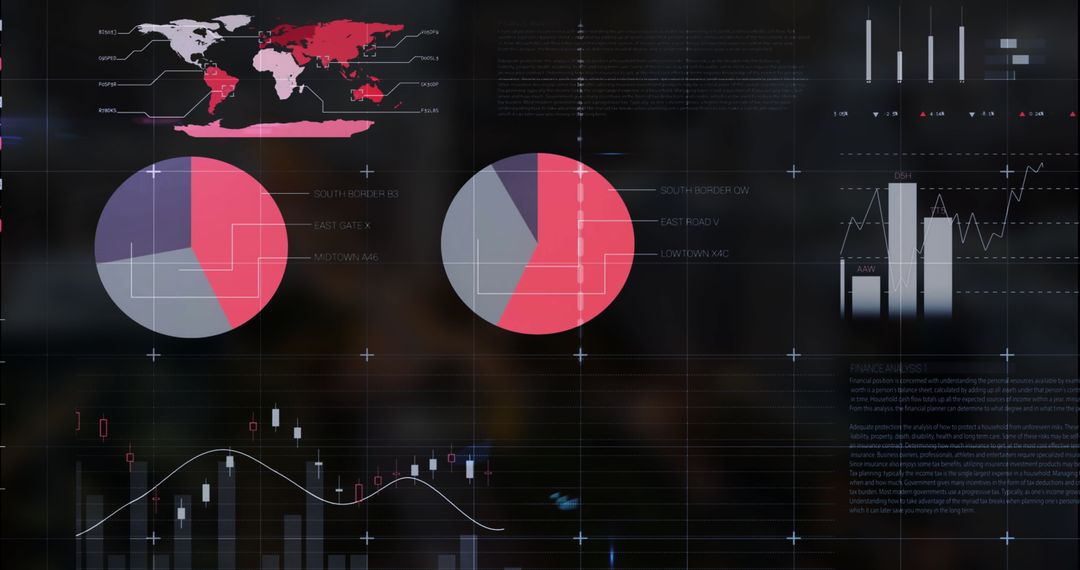
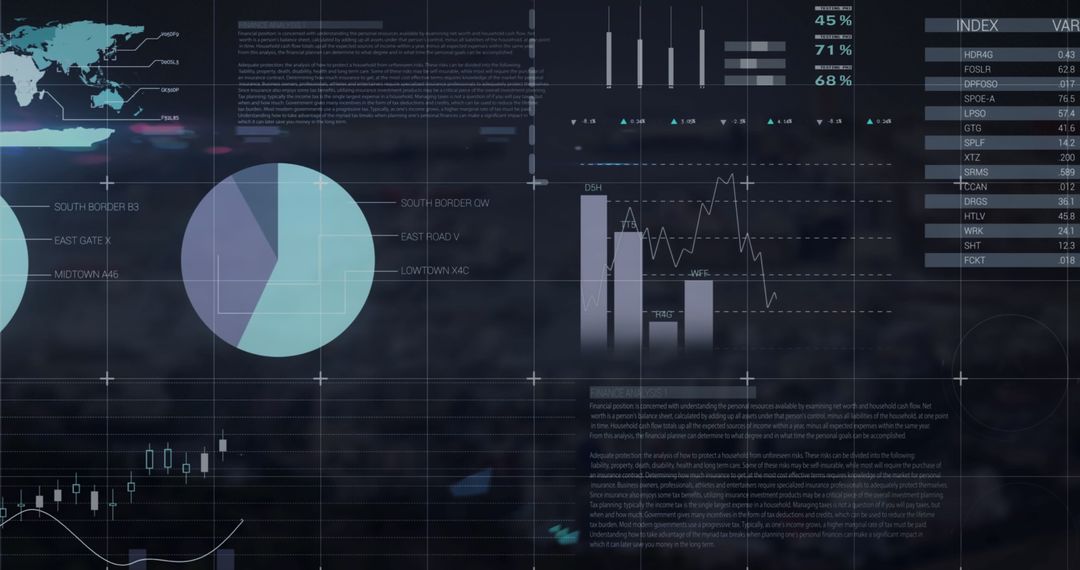
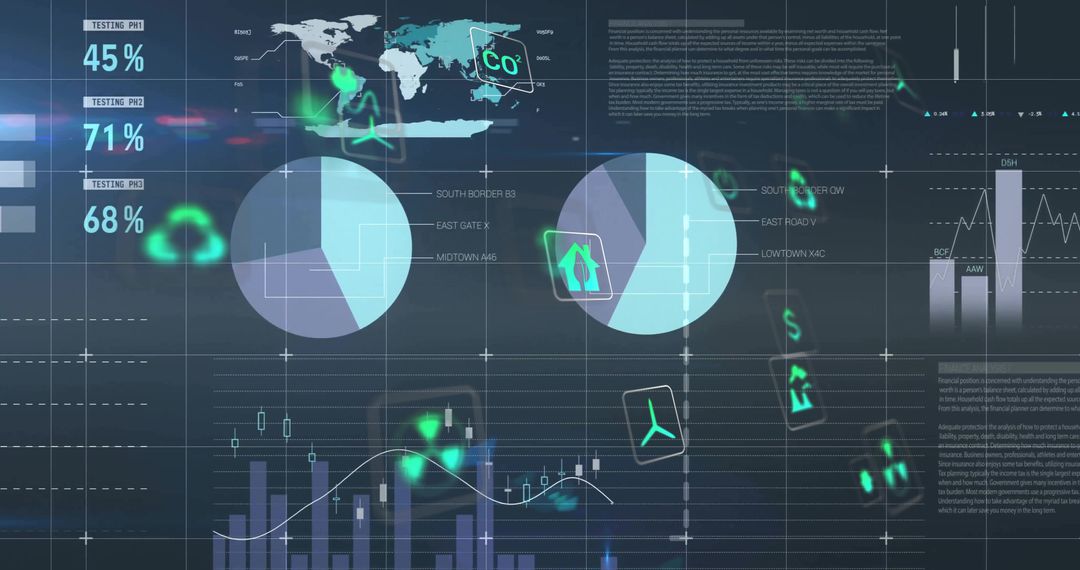
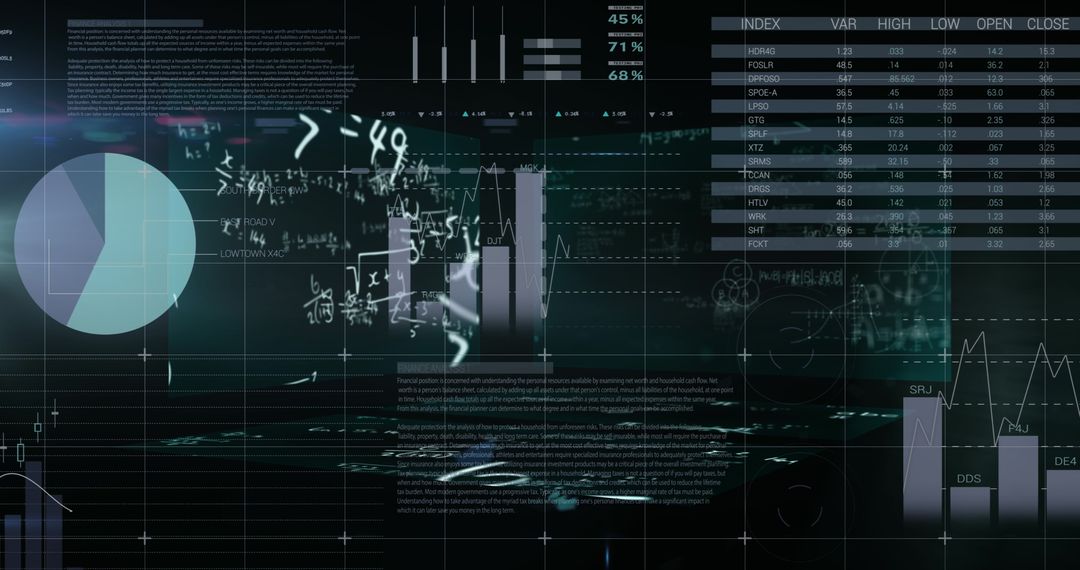
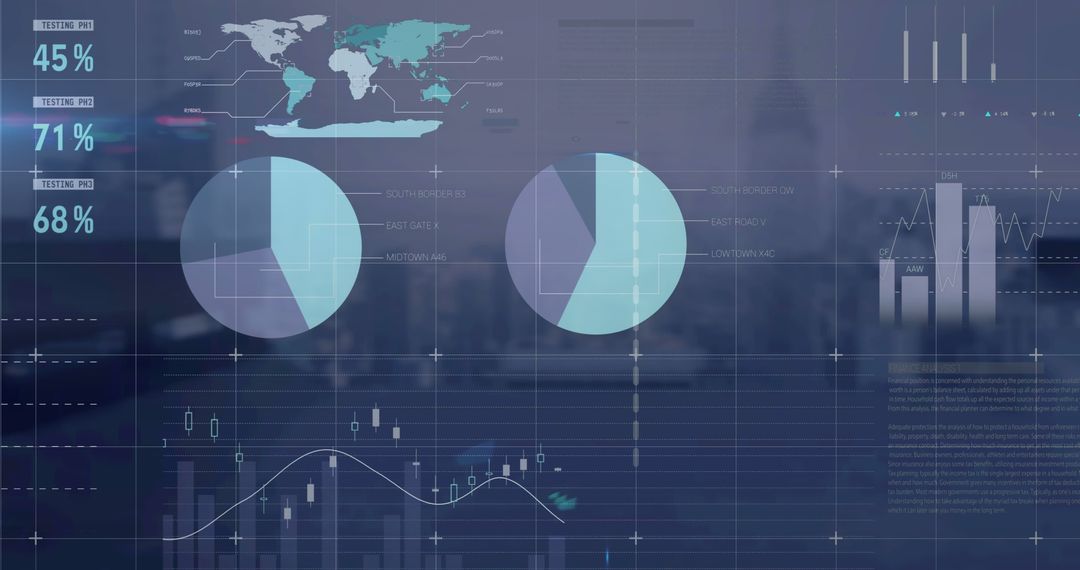
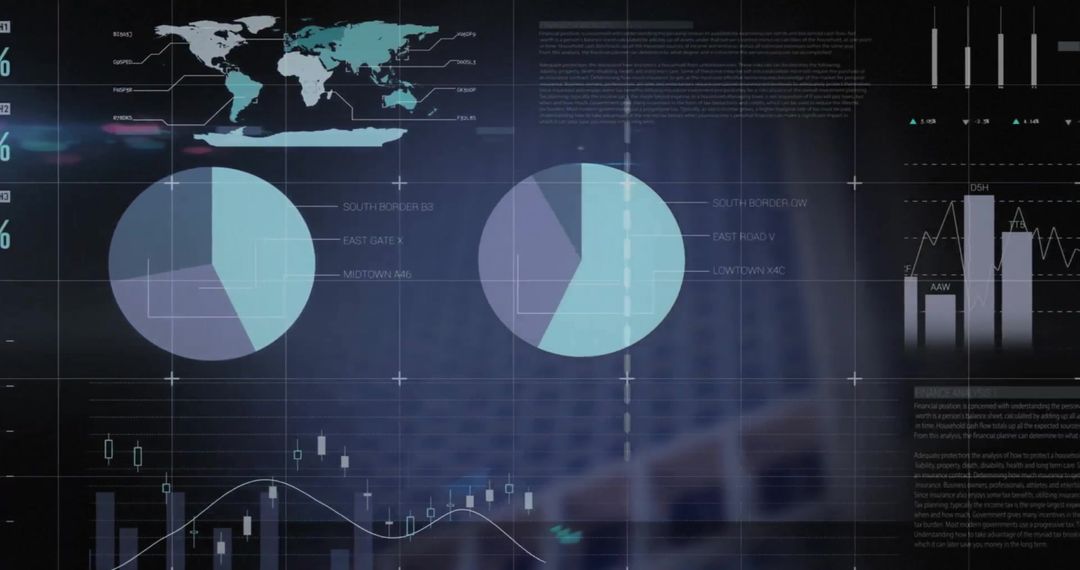
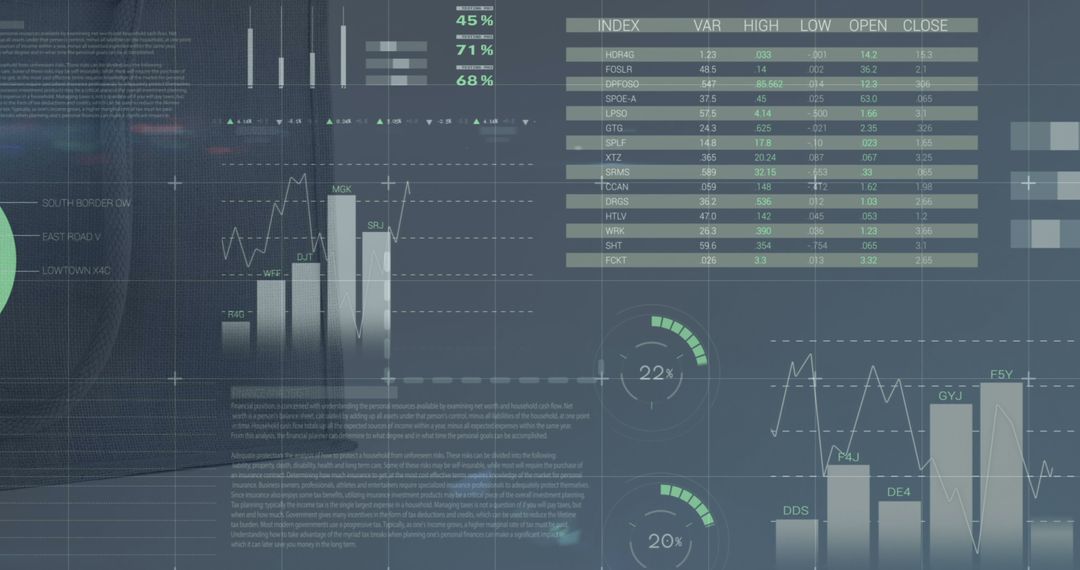
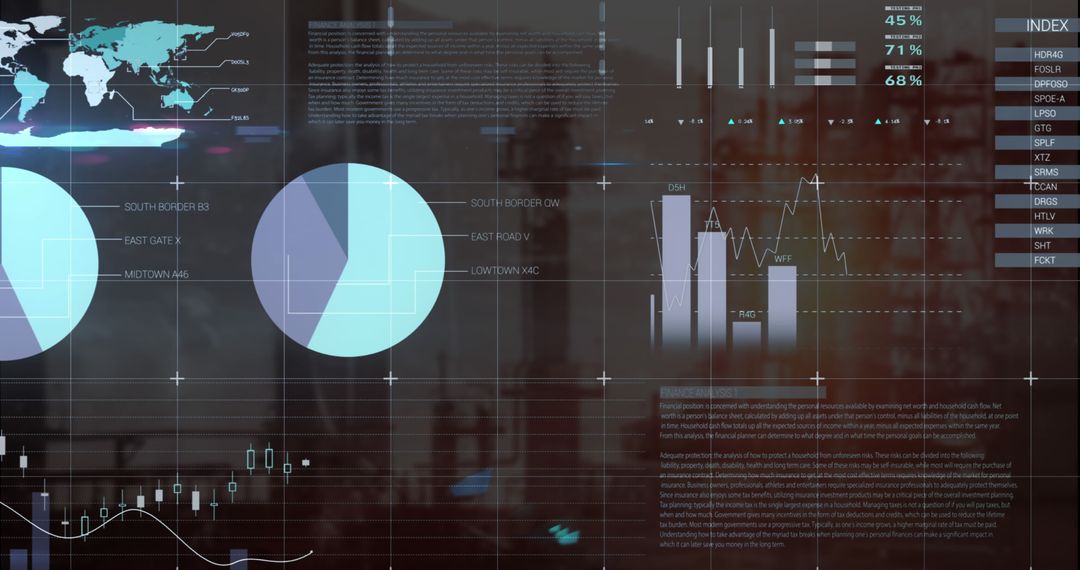
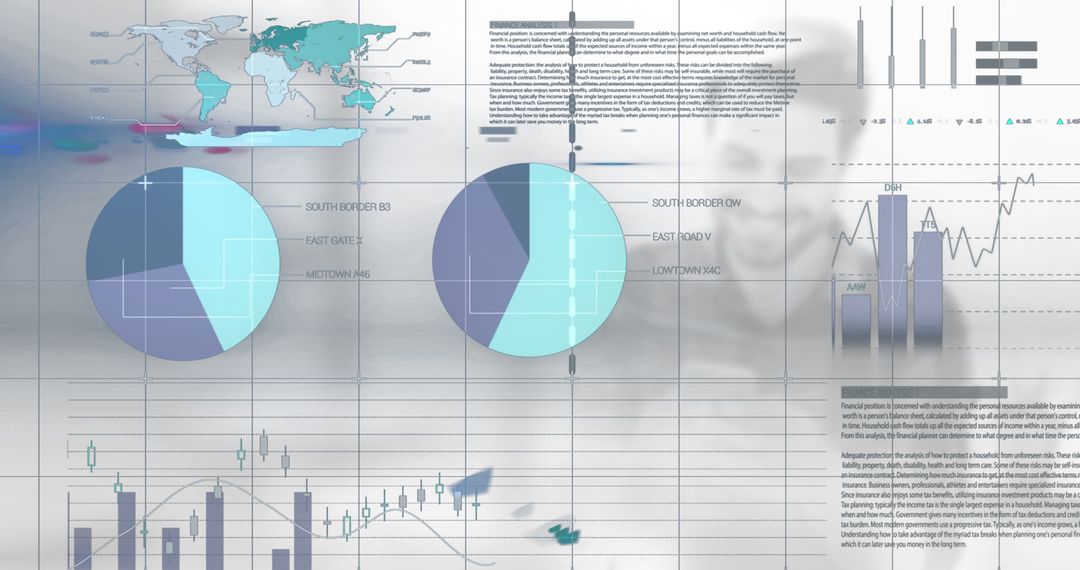
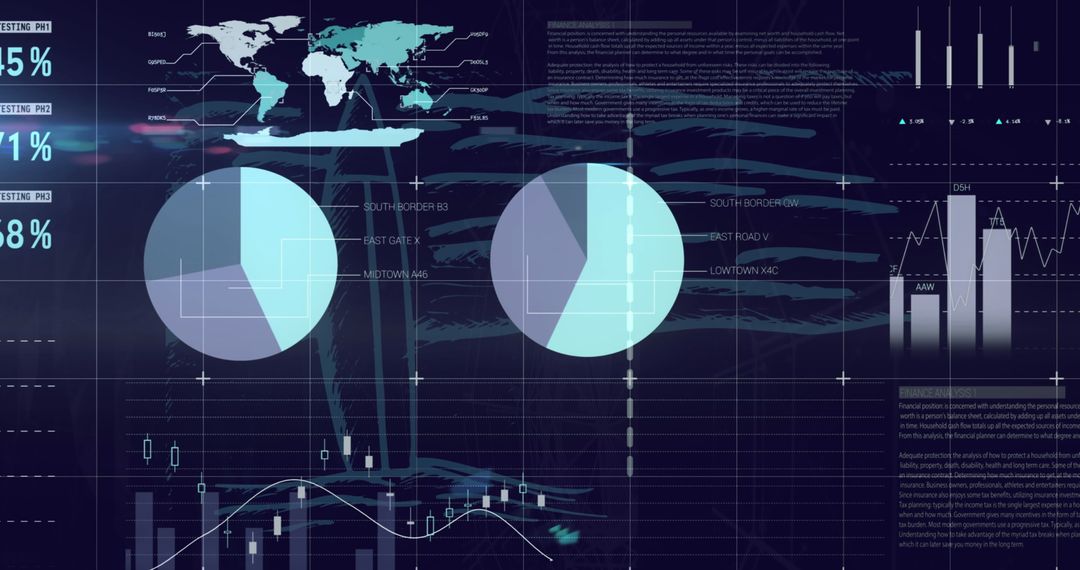
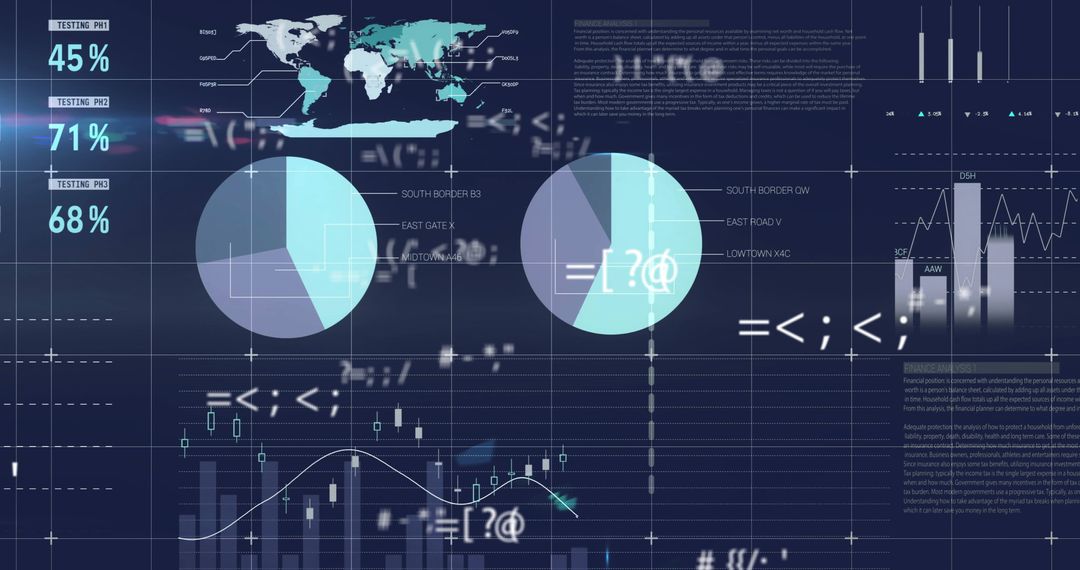
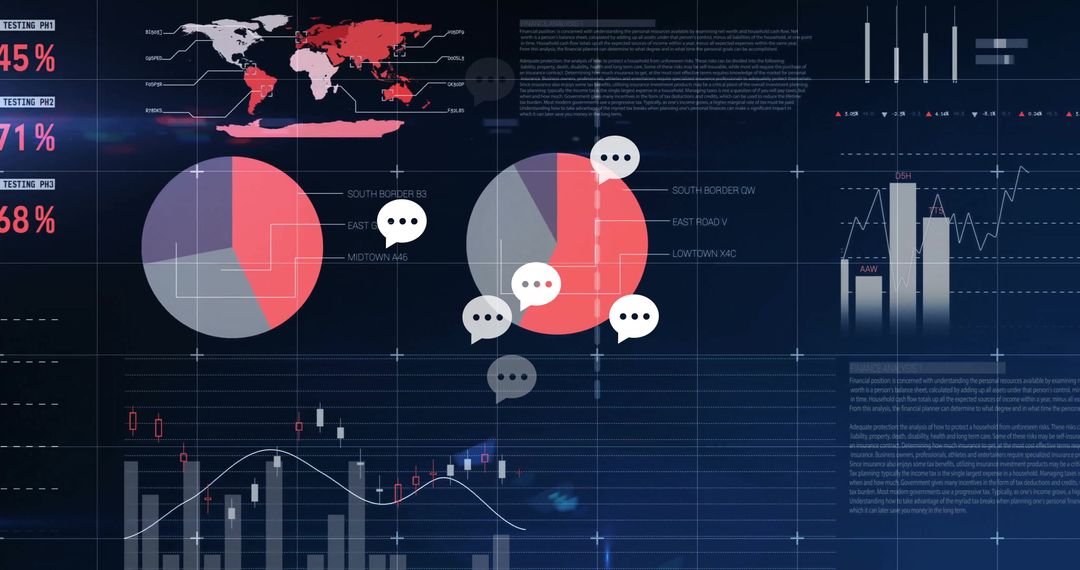
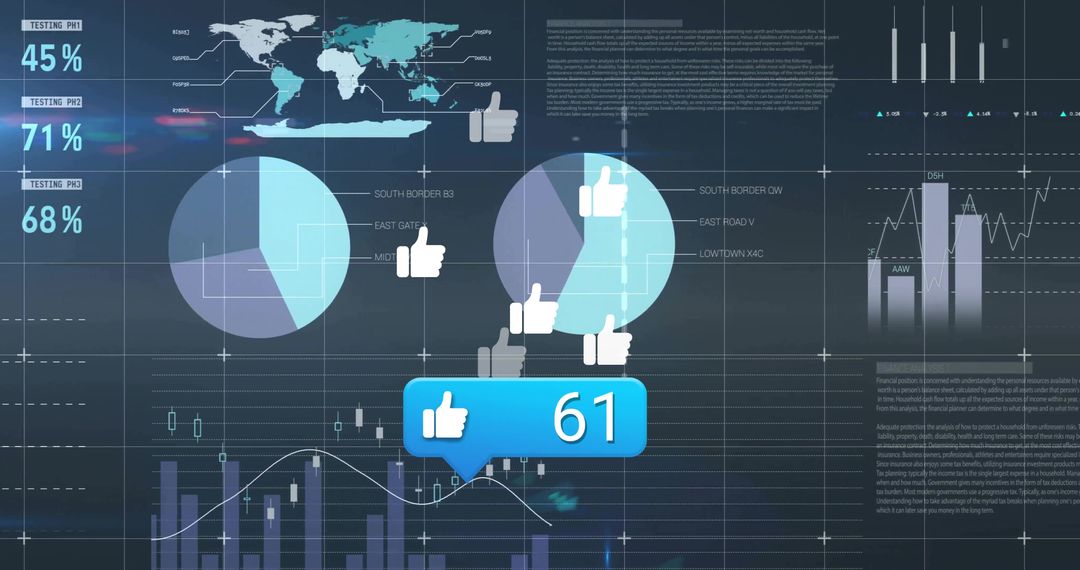
- Digital Interface Displaying Financial and Data Charts in Blue Tones
Digital Interface Displaying Financial and Data Charts in Blue Tones Image

The image showcases a digital interface with various financial and data charts displayed in a range of blue tones. These include line graphs, pie charts, and numerical data tables, all set against an abstract background. This visually represents financial analysis and could be used for business presentations, reports, or economic research materials emphasizing design and analytics.
Powered by  - Get 15% off with code: PIKWIZARD15


5
downloads
downloads
Tags:
More
Credit Photo
If you would like to credit the Photo, here are some ways you can do so
Text Link
photo Link
<span class="text-link">
<span>
<a target="_blank" href=https://pikwizard.com/photo/digital-interface-displaying-financial-and-data-charts-in-blue-tones/3cef6ecb946d347881038847b81167d1/>PikWizard</a>
</span>
</span>
<span class="image-link">
<span
style="margin: 0 0 20px 0; display: inline-block; vertical-align: middle; width: 100%;"
>
<a
target="_blank"
href="https://pikwizard.com/photo/digital-interface-displaying-financial-and-data-charts-in-blue-tones/3cef6ecb946d347881038847b81167d1/"
style="text-decoration: none; font-size: 10px; margin: 0;"
>
<img src="https://pikwizard.com/pw/medium/3cef6ecb946d347881038847b81167d1.jpg" style="margin: 0; width: 100%;" alt="" />
<p style="font-size: 12px; margin: 0;">PikWizard</p>
</a>
</span>
</span>
Free (free of charge)
Free for personal and commercial use.
Author: Awesome Content
Similar Free Stock Images
Premium


Premium


Premium


Premium


Premium


Premium


Premium


Premium


Premium

Premium


Premium


Premium


Premium


Premium


Premium


Premium


Premium


Premium


Premium


Premium

Premium


Premium


Premium

Premium