
- Home >
- Stock Photos >
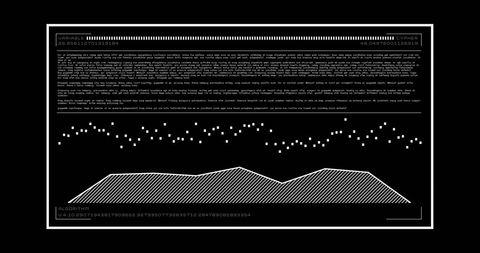
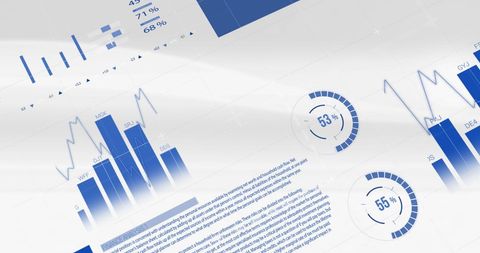
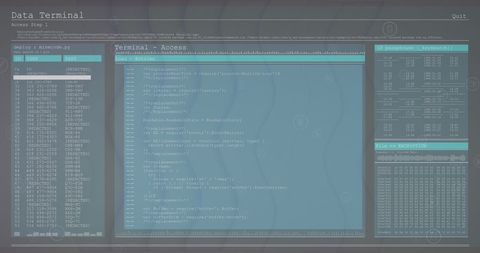
- Digital Interface Displaying Financial Data Analytics
Digital Interface Displaying Financial Data Analytics Image

Visualizing financial data on a digital platform is a cornerstone aspect of combining analytics with contemporary business intelligence. Use this for articles or presentations concerning technological advancements in finance, data visualization in stock markets, or global economic strategies.
Powered by 


downloads
Tags:
More
Credit Photo
If you would like to credit the Photo, here are some ways you can do so
Text Link
photo Link
<span class="text-link">
<span>
<a target="_blank" href=https://pikwizard.com/photo/digital-interface-displaying-financial-data-analytics/5f7ae599f2470c143999c2067cbf447c/>PikWizard</a>
</span>
</span>
<span class="image-link">
<span
style="margin: 0 0 20px 0; display: inline-block; vertical-align: middle; width: 100%;"
>
<a
target="_blank"
href="https://pikwizard.com/photo/digital-interface-displaying-financial-data-analytics/5f7ae599f2470c143999c2067cbf447c/"
style="text-decoration: none; font-size: 10px; margin: 0;"
>
<img src="https://pikwizard.com/pw/medium/5f7ae599f2470c143999c2067cbf447c.jpg" style="margin: 0; width: 100%;" alt="" />
<p style="font-size: 12px; margin: 0;">PikWizard</p>
</a>
</span>
</span>
Free (free of charge)
Free for personal and commercial use.
Author: Awesome Content
Similar Free Stock Images
Premium


Premium


Premium

Premium

Premium

Premium


Premium


Premium


Premium


Premium


Premium


Premium

Premium


Premium


Premium


Premium


Premium

Premium

Premium


Premium


Premium


Premium


Premium


Premium

Premium


Explore More Free Stock Images