
- Home >
- Stock Photos >
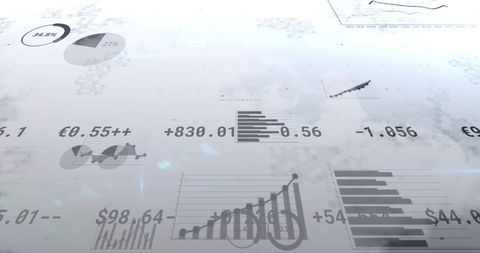
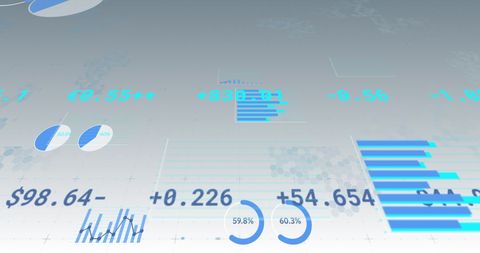
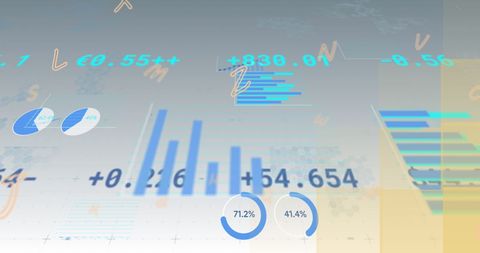
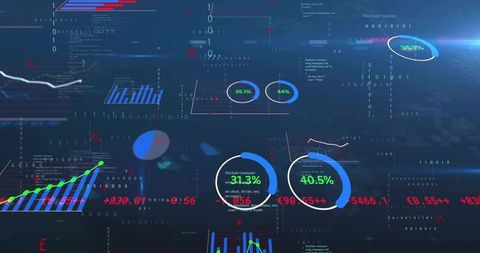
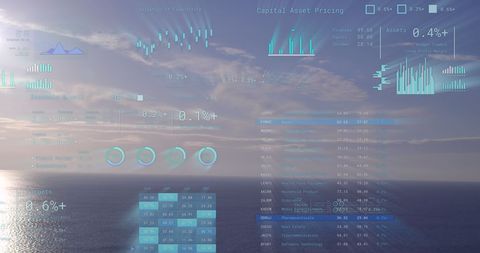
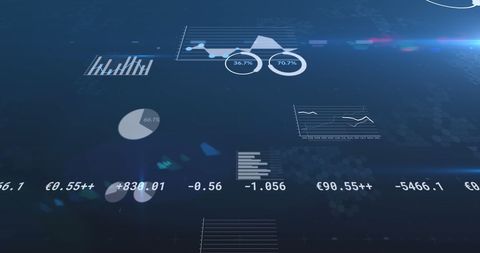
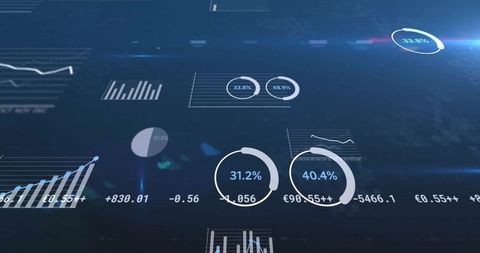
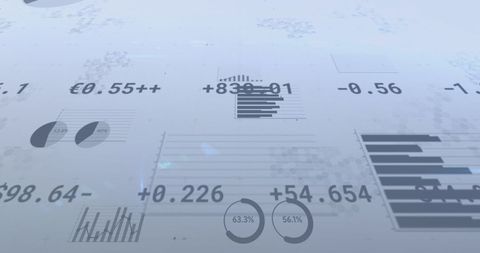
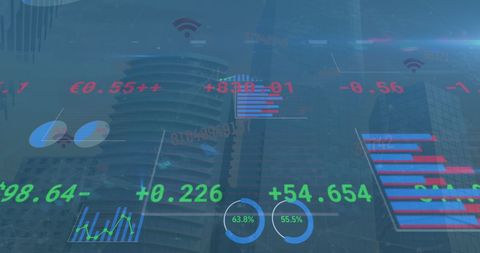
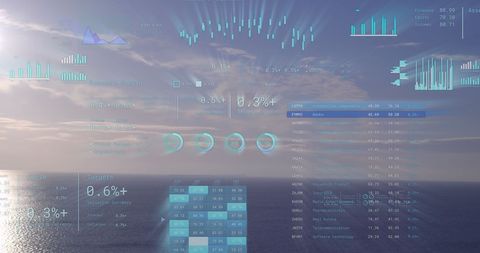
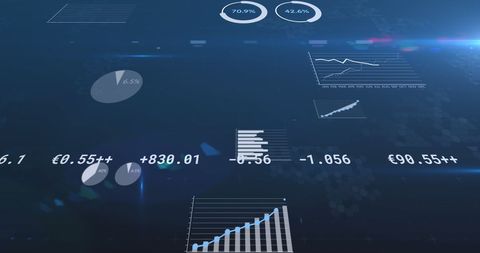
- Digital Interface Displaying Financial Data with Graphs
Digital Interface Displaying Financial Data with Graphs Image

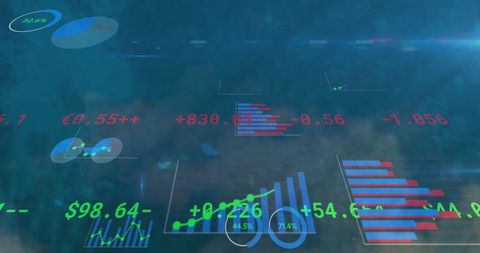
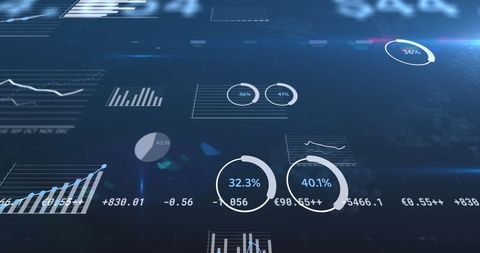
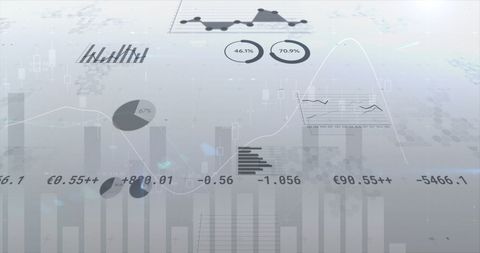
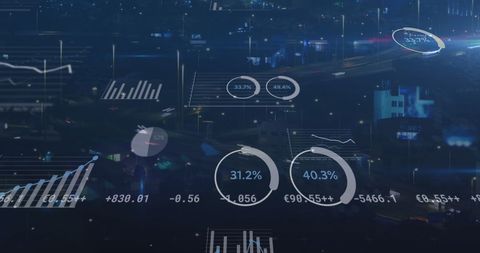
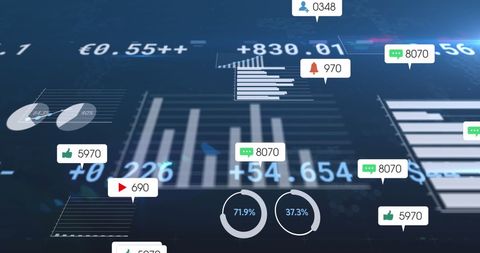
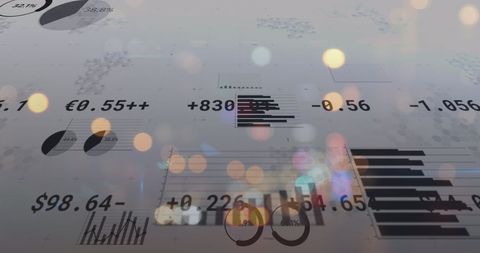
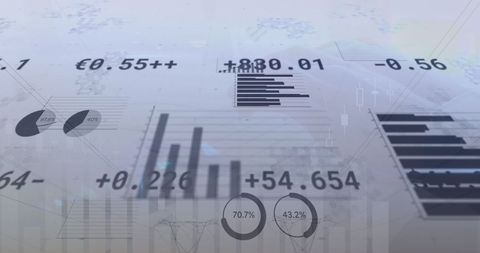
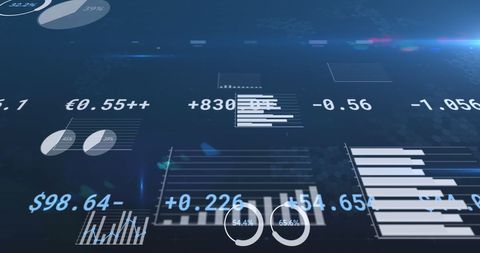
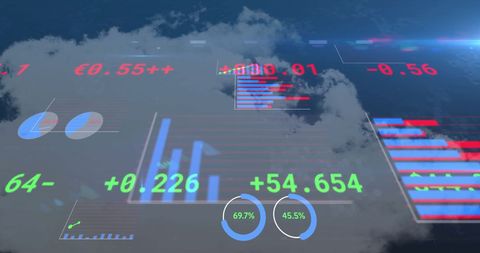
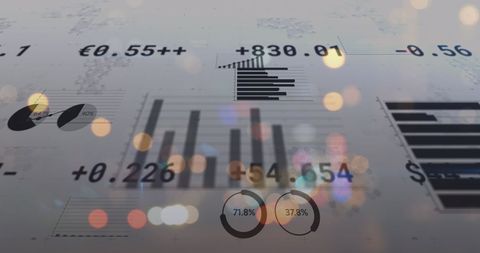
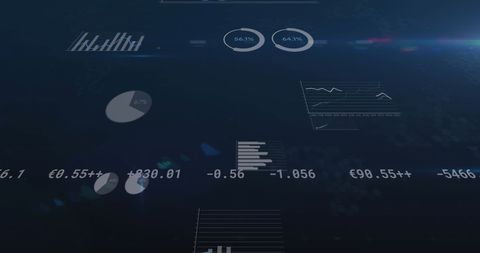
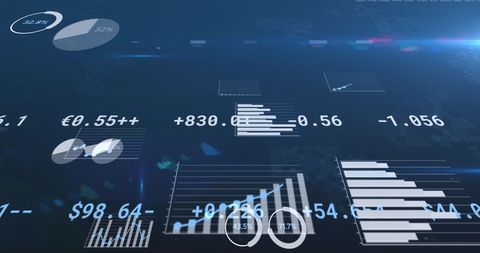
This futuristic digital display showcases financial data with charts and numbers changing dynamically, suggesting a global business and finance concept. Ideal for illustrating themes related to economic analysis, financial report presentations, investment strategies, and digital economy impact.
Powered by 


downloads
Tags:
More
Credit Photo
If you would like to credit the Photo, here are some ways you can do so
Text Link
photo Link
<span class="text-link">
<span>
<a target="_blank" href=https://pikwizard.com/photo/digital-interface-displaying-financial-data-with-graphs/7c47aab5af3d2ebac7d18a1596c77188/>PikWizard</a>
</span>
</span>
<span class="image-link">
<span
style="margin: 0 0 20px 0; display: inline-block; vertical-align: middle; width: 100%;"
>
<a
target="_blank"
href="https://pikwizard.com/photo/digital-interface-displaying-financial-data-with-graphs/7c47aab5af3d2ebac7d18a1596c77188/"
style="text-decoration: none; font-size: 10px; margin: 0;"
>
<img src="https://pikwizard.com/pw/medium/7c47aab5af3d2ebac7d18a1596c77188.jpg" style="margin: 0; width: 100%;" alt="" />
<p style="font-size: 12px; margin: 0;">PikWizard</p>
</a>
</span>
</span>
Free (free of charge)
Free for personal and commercial use.
Author: Awesome Content
Similar Free Stock Images

Premium

Premium


Premium


Premium


Premium

Premium


Premium


Premium

Premium


Premium


Premium


Premium


Premium


Premium


Premium


Premium


Premium


Premium


Premium


Premium

Premium


Premium


Premium


Premium


Premium


Explore More Free Stock Images