- Home >
- Stock Photos >
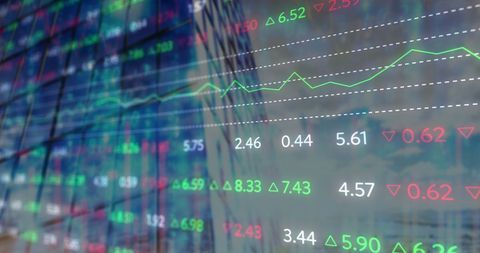
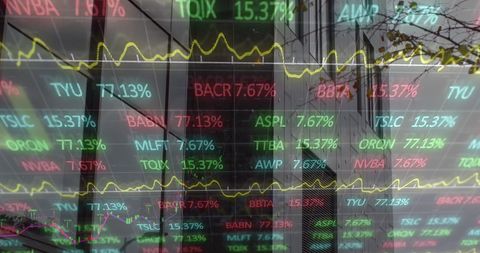
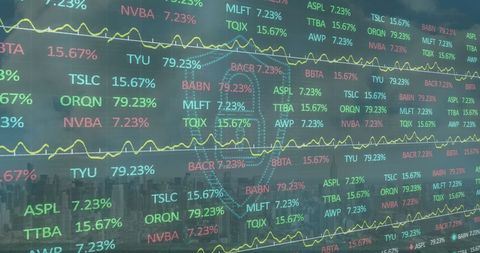
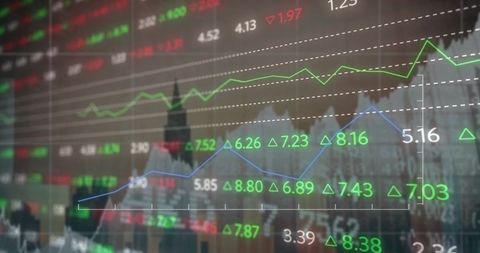
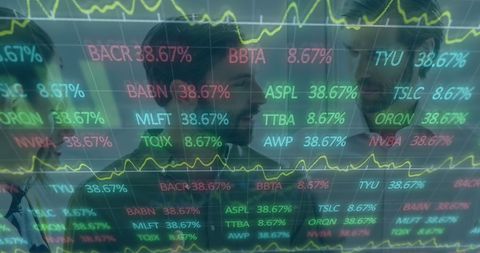
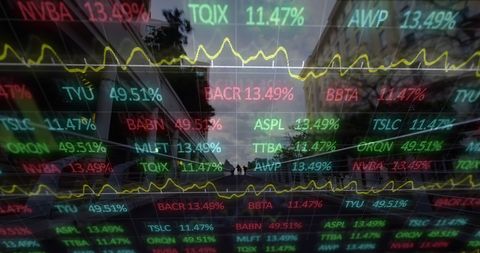
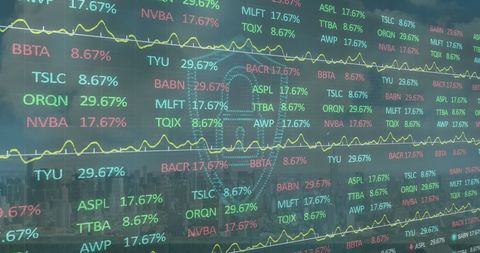
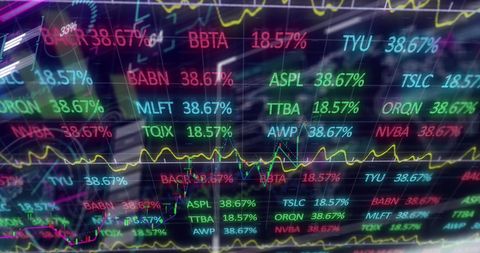
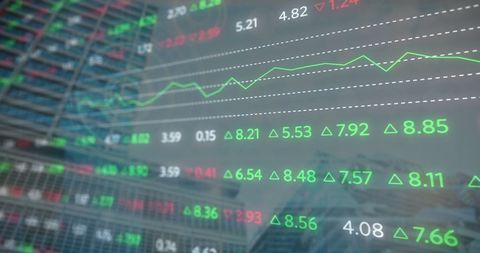
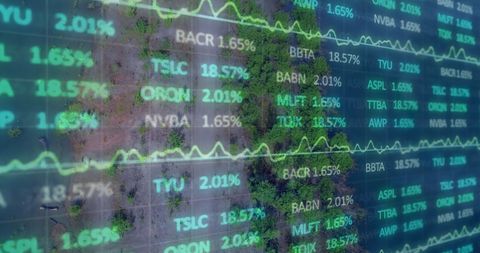
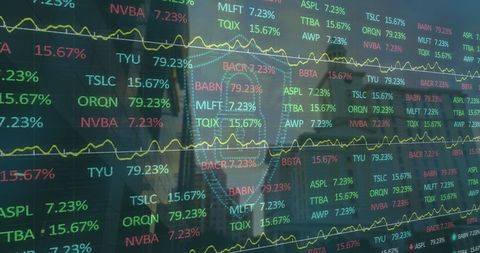
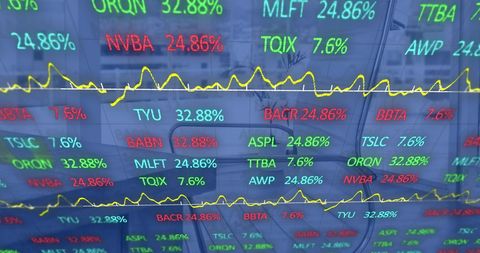
- Digital Interface Displaying Financial Graphs and Data Analytics
Digital Interface Displaying Financial Graphs and Data Analytics Image

Digital composite showcasing layered financial graphs and stock data against business buildings. It captures the complexity of global finance and economy. Useful for articles on financial markets, economic forecasts, or business strategy insights.

downloads
Tags:
More
Credit Photo
If you would like to credit the Photo, here are some ways you can do so
Text Link
photo Link
<span class="text-link">
<span>
<a target="_blank" href=https://pikwizard.com/photo/digital-interface-displaying-financial-graphs-and-data-analytics/91fe9e95fc44097f4e8cee62fe624861/>PikWizard</a>
</span>
</span>
<span class="image-link">
<span
style="margin: 0 0 20px 0; display: inline-block; vertical-align: middle; width: 100%;"
>
<a
target="_blank"
href="https://pikwizard.com/photo/digital-interface-displaying-financial-graphs-and-data-analytics/91fe9e95fc44097f4e8cee62fe624861/"
style="text-decoration: none; font-size: 10px; margin: 0;"
>
<img src="https://pikwizard.com/pw/medium/91fe9e95fc44097f4e8cee62fe624861.jpg" style="margin: 0; width: 100%;" alt="" />
<p style="font-size: 12px; margin: 0;">PikWizard</p>
</a>
</span>
</span>
Free (free of charge)
Free for personal and commercial use.
Author: People Creations