
- Home >
- Stock Photos >
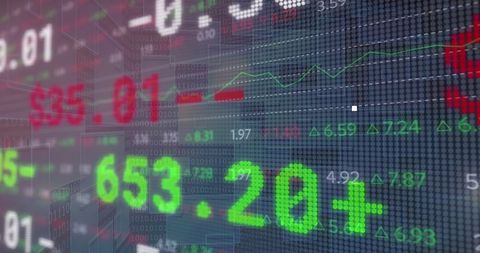
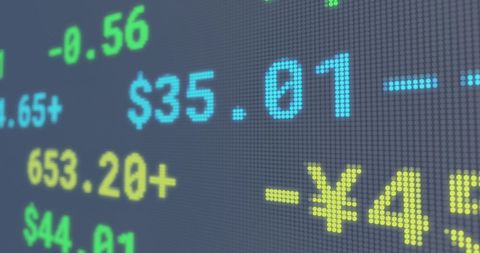
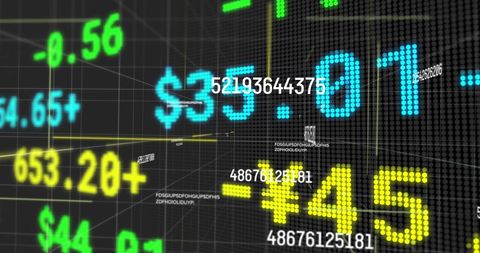
- Digital Interface Displaying Global Financial Data Analysis
Digital Interface Displaying Global Financial Data Analysis Image

Emphasizing fast-paced global finances, image shows display screens mixed with financial figures and currency symbols. Ideal for financial blogs, market trend articles, or educational materials discussing economies, data analysis, and implications of financial technology advancements.
Powered by 


downloads
Tags:
More
Credit Photo
If you would like to credit the Photo, here are some ways you can do so
Text Link
photo Link
<span class="text-link">
<span>
<a target="_blank" href=https://pikwizard.com/photo/digital-interface-displaying-global-financial-data-analysis/b42378b4a60e96fa07f1c931b2b1a882/>PikWizard</a>
</span>
</span>
<span class="image-link">
<span
style="margin: 0 0 20px 0; display: inline-block; vertical-align: middle; width: 100%;"
>
<a
target="_blank"
href="https://pikwizard.com/photo/digital-interface-displaying-global-financial-data-analysis/b42378b4a60e96fa07f1c931b2b1a882/"
style="text-decoration: none; font-size: 10px; margin: 0;"
>
<img src="https://pikwizard.com/pw/medium/b42378b4a60e96fa07f1c931b2b1a882.jpg" style="margin: 0; width: 100%;" alt="" />
<p style="font-size: 12px; margin: 0;">PikWizard</p>
</a>
</span>
</span>
Free (free of charge)
Free for personal and commercial use.
Author: People Creations
Similar Free Stock Images

Premium


Premium

Premium


Premium


Premium


Premium


Premium


Premium


Premium


Premium


Premium


Premium


Premium


Premium

Premium


Premium

Premium


Premium


Premium


Premium


Premium


Premium


Premium


Premium


Premium

Explore More Free Stock Images