- Home >
- Stock Photos >
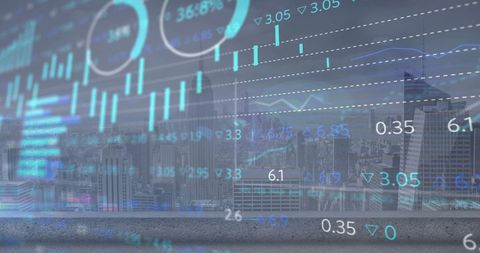
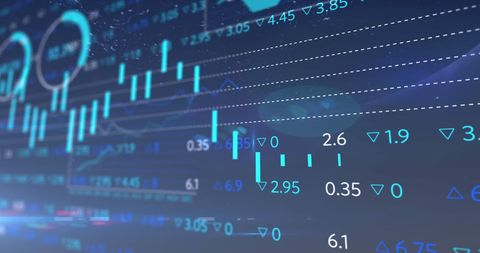
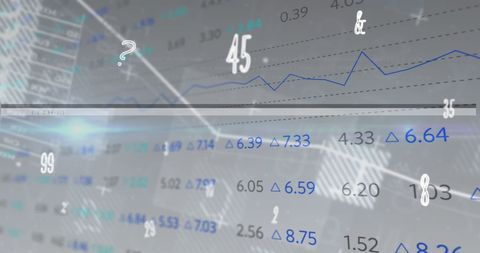
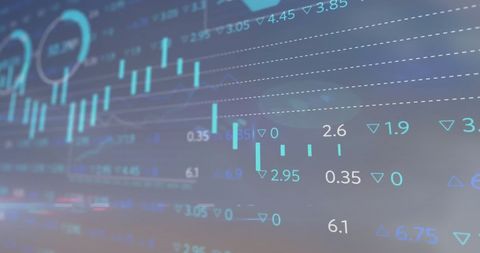
- Digital Interface Displaying Real-Time Financial Data
Digital Interface Displaying Real-Time Financial Data Image

This visually arresting depiction of a real-time financial data display showcases a cutting-edge digital interface with a dark background, featuring various graphs and numerical information. Perfect for illustrating concepts in finance, stock market analysis, data processing, or technological advancements. Ideal for use in professional presentations, financial education materials, or on business-related websites.

downloads
Tags:
More
Credit Photo
If you would like to credit the Photo, here are some ways you can do so
Text Link
photo Link
<span class="text-link">
<span>
<a target="_blank" href=https://pikwizard.com/photo/digital-interface-displaying-real-time-financial-data/871ca7d9b0beb67f79956b4390de3c28/>PikWizard</a>
</span>
</span>
<span class="image-link">
<span
style="margin: 0 0 20px 0; display: inline-block; vertical-align: middle; width: 100%;"
>
<a
target="_blank"
href="https://pikwizard.com/photo/digital-interface-displaying-real-time-financial-data/871ca7d9b0beb67f79956b4390de3c28/"
style="text-decoration: none; font-size: 10px; margin: 0;"
>
<img src="https://pikwizard.com/pw/medium/871ca7d9b0beb67f79956b4390de3c28.jpg" style="margin: 0; width: 100%;" alt="" />
<p style="font-size: 12px; margin: 0;">PikWizard</p>
</a>
</span>
</span>
Free (free of charge)
Free for personal and commercial use.
Author: Awesome Content