
- Home >
- Stock Photos >
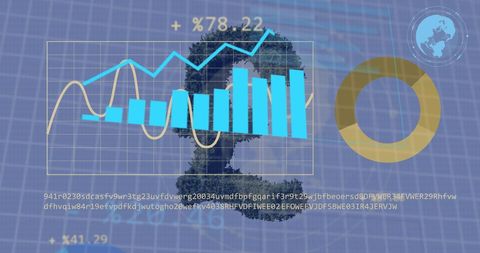
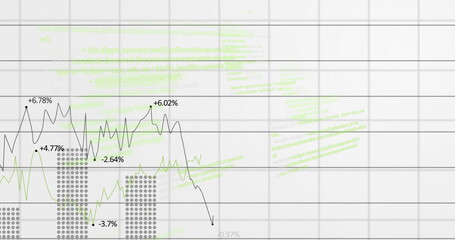
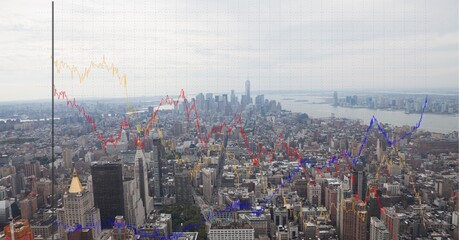
- Digital Interface Displaying Statistical Data on Grid Network Background
Digital Interface Displaying Statistical Data on Grid Network Background Image

This digital illustration presents a modern interface with processing statistical data overlaid on a grid network background. It symbolizes technological advancements in the business, finance, and computing sectors. Ideal for use in presentations discussing technological developments, global connections, or financial analysis.
Powered by 


downloads
Tags:
More
Credit Photo
If you would like to credit the Photo, here are some ways you can do so
Text Link
photo Link
<span class="text-link">
<span>
<a target="_blank" href=https://pikwizard.com/photo/digital-interface-displaying-statistical-data-on-grid-network-background/85c2e213f6ab339399f4373159387a1b/>PikWizard</a>
</span>
</span>
<span class="image-link">
<span
style="margin: 0 0 20px 0; display: inline-block; vertical-align: middle; width: 100%;"
>
<a
target="_blank"
href="https://pikwizard.com/photo/digital-interface-displaying-statistical-data-on-grid-network-background/85c2e213f6ab339399f4373159387a1b/"
style="text-decoration: none; font-size: 10px; margin: 0;"
>
<img src="https://pikwizard.com/pw/medium/85c2e213f6ab339399f4373159387a1b.jpg" style="margin: 0; width: 100%;" alt="" />
<p style="font-size: 12px; margin: 0;">PikWizard</p>
</a>
</span>
</span>
Free (free of charge)
Free for personal and commercial use.
Author: Creative Art
Similar Free Stock Images

Premium


Premium


Premium


Premium


Premium


Premium


Premium


Premium


Premium


Premium


Premium

Premium


Premium


Premium


Premium


Premium

Premium


Premium


Premium

Premium


Premium


Premium


Premium


Premium


Premium


Explore More Free Stock Images