
- Home >
- Stock Photos >
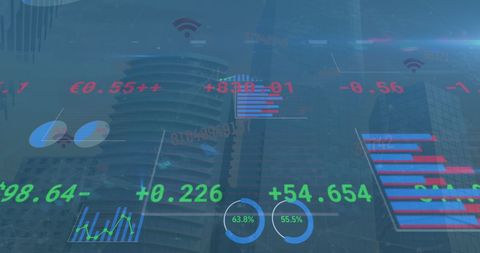
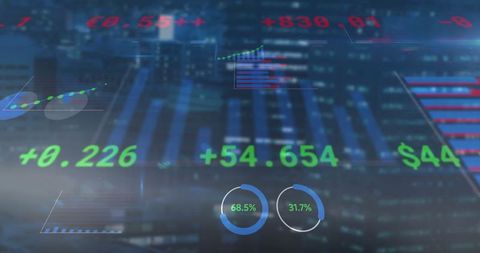
- Digital Interface Displaying Stock Data Trends and Analytics
Digital Interface Displaying Stock Data Trends and Analytics Image

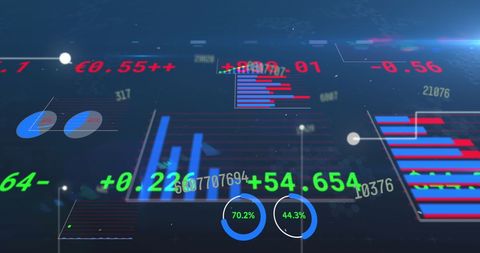
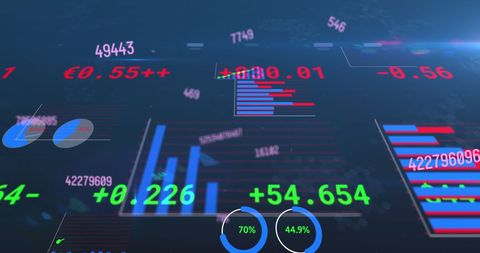
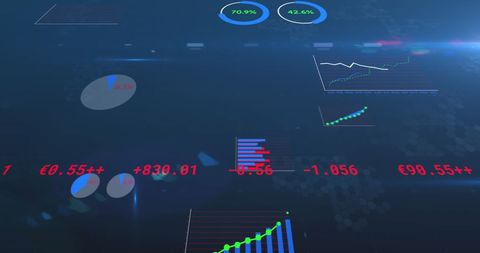
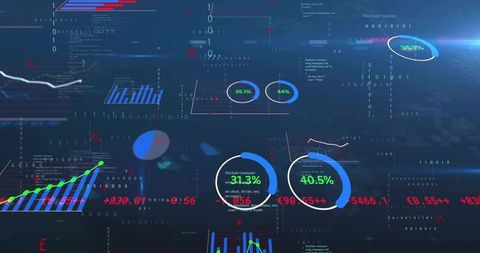
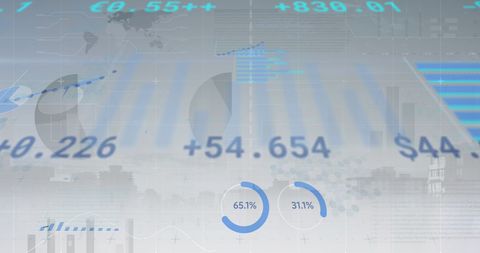
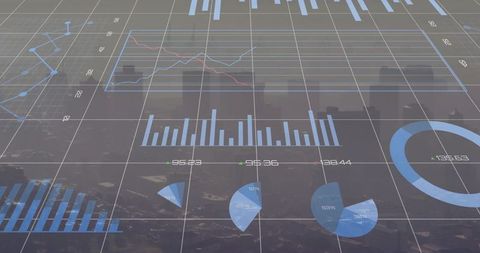
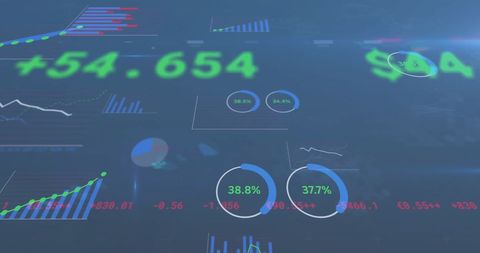
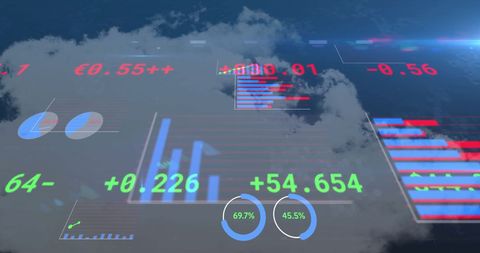
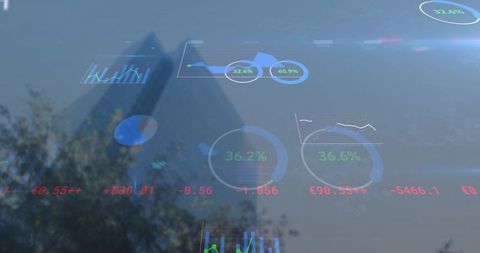
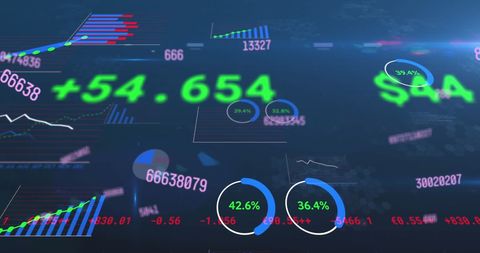
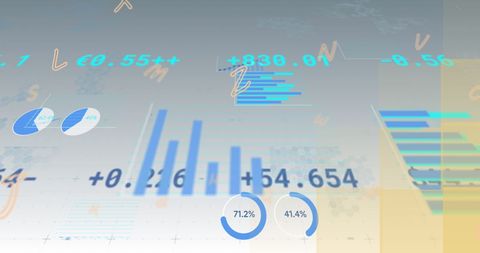
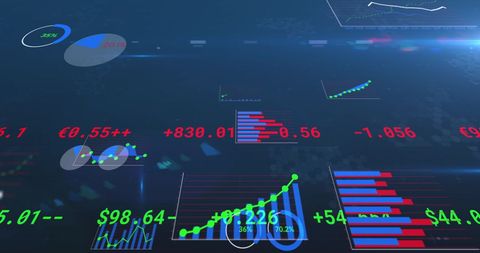
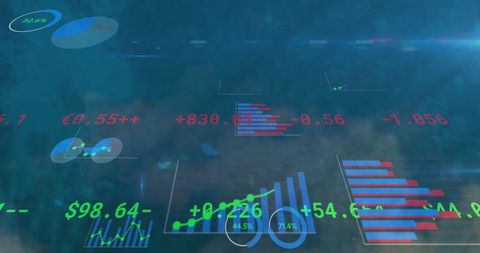
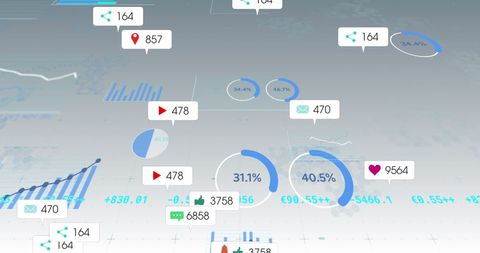
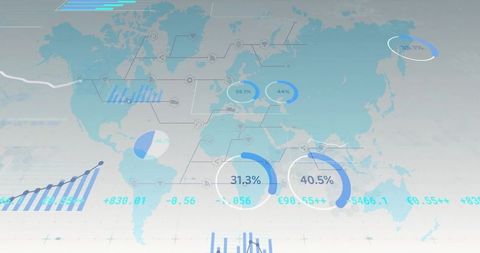
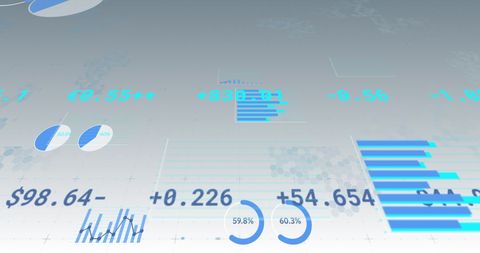
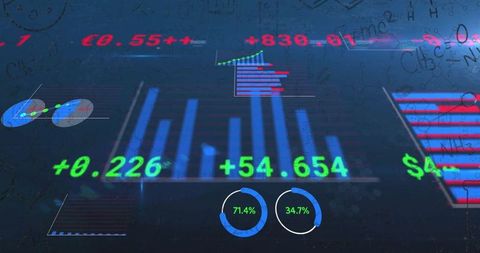
Abstract digital screen showcasing stock data and analytic symbols. Includes numerical data, charts, and holographic overlays for representing finance and market trends. Perfect for illustrating articles on stock market analysis, financial reports, business analytics, and techo-financial topics. Useful for business presentations and educational materials on finance and computing concepts.
Powered by 


downloads
Tags:
More
Credit Photo
If you would like to credit the Photo, here are some ways you can do so
Text Link
photo Link
<span class="text-link">
<span>
<a target="_blank" href=https://pikwizard.com/photo/digital-interface-displaying-stock-data-trends-and-analytics/8758296e11b5306149db104aa16d4033/>PikWizard</a>
</span>
</span>
<span class="image-link">
<span
style="margin: 0 0 20px 0; display: inline-block; vertical-align: middle; width: 100%;"
>
<a
target="_blank"
href="https://pikwizard.com/photo/digital-interface-displaying-stock-data-trends-and-analytics/8758296e11b5306149db104aa16d4033/"
style="text-decoration: none; font-size: 10px; margin: 0;"
>
<img src="https://pikwizard.com/pw/medium/8758296e11b5306149db104aa16d4033.jpg" style="margin: 0; width: 100%;" alt="" />
<p style="font-size: 12px; margin: 0;">PikWizard</p>
</a>
</span>
</span>
Free (free of charge)
Free for personal and commercial use.
Author: Awesome Content
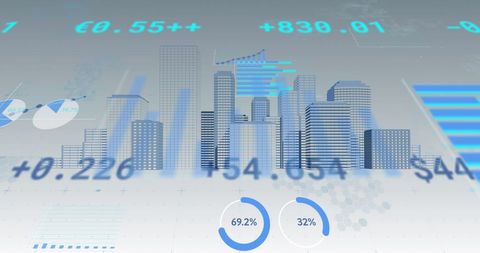
Similar Free Stock Images

Premium

Premium

Premium


Premium


Premium


Premium


Premium

Premium


Premium


Premium


Premium


Premium


Premium


Premium


Premium


Premium

Premium


Premium


Premium


Premium


Premium

Premium


Premium


Premium


Premium


Explore More Free Stock Images