
- Home >
- Stock Photos >
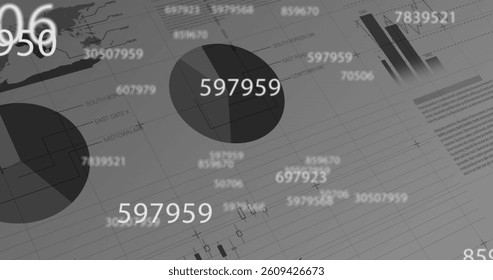
- Digital Interface Financial Data Analysis Background
Digital Interface Financial Data Analysis Background Image
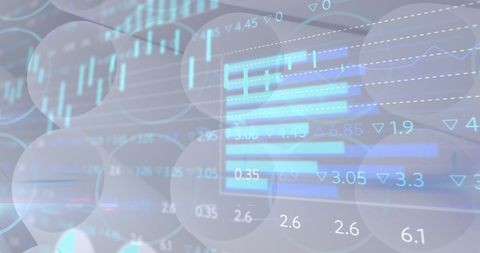
Depicts a digital interface with various graphs and charts representing financial data, ideal for illustrating concepts related to data analysis, global finance, business analytics, trading platforms, or the technology behind economic forecasting. Useful in presentations, financial reports, and articles related to technology advancements in financial markets.
Powered by  - Get 15% off with code: PIKWIZARD15


downloads
Tags:
More
Credit Photo
If you would like to credit the Photo, here are some ways you can do so
Text Link
photo Link
<span class="text-link">
<span>
<a target="_blank" href=https://pikwizard.com/photo/digital-interface-financial-data-analysis-background/0bb856171dec1855ce5b61716fd0e85a/>PikWizard</a>
</span>
</span>
<span class="image-link">
<span
style="margin: 0 0 20px 0; display: inline-block; vertical-align: middle; width: 100%;"
>
<a
target="_blank"
href="https://pikwizard.com/photo/digital-interface-financial-data-analysis-background/0bb856171dec1855ce5b61716fd0e85a/"
style="text-decoration: none; font-size: 10px; margin: 0;"
>
<img src="https://pikwizard.com/pw/medium/0bb856171dec1855ce5b61716fd0e85a.jpg" style="margin: 0; width: 100%;" alt="" />
<p style="font-size: 12px; margin: 0;">PikWizard</p>
</a>
</span>
</span>
Free (free of charge)
Free for personal and commercial use.
Author: Authentic Images
Similar Free Stock Images

Premium


Premium


Premium


Premium


Premium


Premium


Premium


Premium


Premium


Premium


Premium


Premium

Premium


Premium


Premium
Premium

Premium


Premium


Premium
Premium


Premium


Premium


Premium


Premium

Premium


Explore More Free Stock Images