- Home >
- Stock Photos >
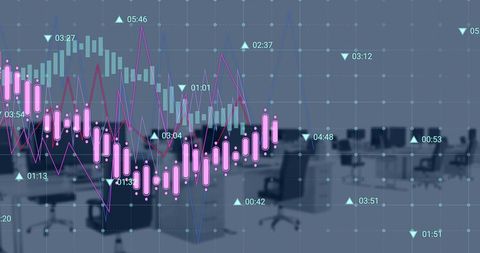
- Digital Interface Graph Data Analytics Tech Overlay
Digital Interface Graph Data Analytics Tech Overlay Image
Visual integration of computer technology with a digital data analytics interface, showcasing fluctuating graphs and economic markers essential for business progress representations. This can be effectively used for illustrating topics on economic insights, financial reviews, or for enhancing tech-centric marketing materials.

downloads
Tags:
More
Credit Photo
If you would like to credit the Photo, here are some ways you can do so
Text Link
photo Link
<span class="text-link">
<span>
<a target="_blank" href=https://pikwizard.com/photo/digital-interface-graph-data-analytics-tech-overlay/b7c3dc4cd45ae05e639a64a78f94a267/>PikWizard</a>
</span>
</span>
<span class="image-link">
<span
style="margin: 0 0 20px 0; display: inline-block; vertical-align: middle; width: 100%;"
>
<a
target="_blank"
href="https://pikwizard.com/photo/digital-interface-graph-data-analytics-tech-overlay/b7c3dc4cd45ae05e639a64a78f94a267/"
style="text-decoration: none; font-size: 10px; margin: 0;"
>
<img src="https://pikwizard.com/pw/medium/b7c3dc4cd45ae05e639a64a78f94a267.jpg" style="margin: 0; width: 100%;" alt="" />
<p style="font-size: 12px; margin: 0;">PikWizard</p>
</a>
</span>
</span>
Free (free of charge)
Free for personal and commercial use.
Author: Awesome Content