- Home >
- Stock Photos >
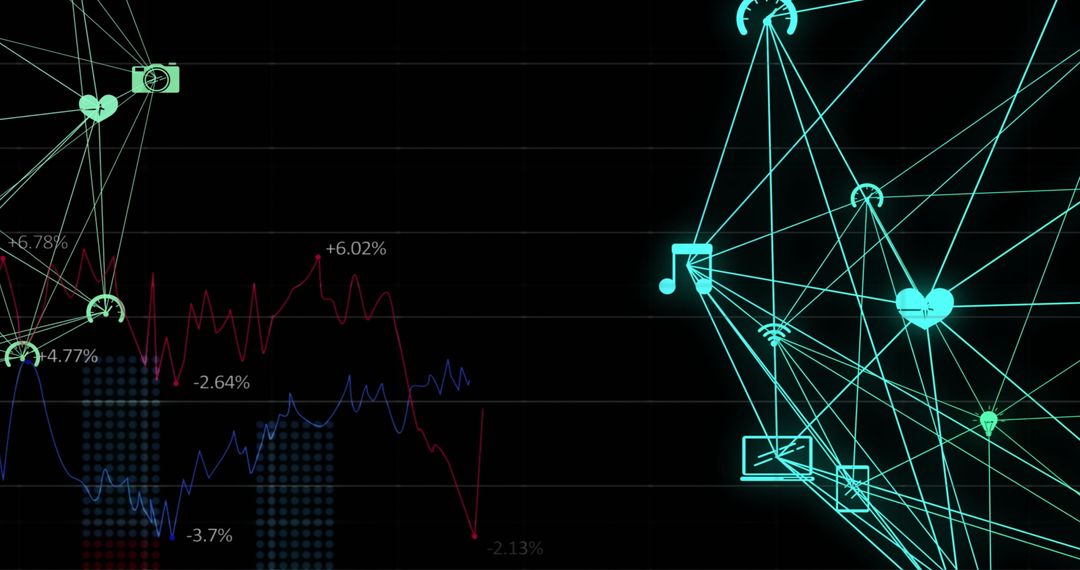
- Digital Interface of Financial Data over Scaffold Grid Overlay
Digital Interface of Financial Data over Scaffold Grid Overlay Image
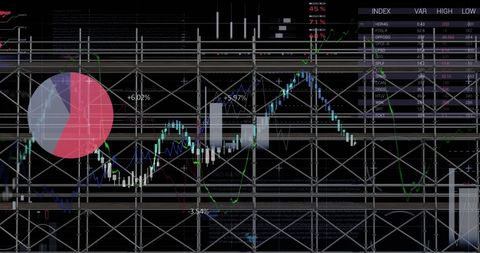
This visual represents the integration of technology and global business development. It depicts financial data processing and analysis with a digital interface superimposed over a scaffolding-like grid. Ideal for use in articles or presentations discussing economics, data visualization, business strategy, or technological advances impacting financial sectors.
Powered by 


0
downloads
downloads
Tags:
More
Credit Photo
If you would like to credit the Photo, here are some ways you can do so
Text Link
photo Link
<span class="text-link">
<span>
<a target="_blank" href=https://pikwizard.com/photo/digital-interface-of-financial-data-over-scaffold-grid-overlay/597e8559dab6b56cab7ae79439af9fdc/>PikWizard</a>
</span>
</span>
<span class="image-link">
<span
style="margin: 0 0 20px 0; display: inline-block; vertical-align: middle; width: 100%;"
>
<a
target="_blank"
href="https://pikwizard.com/photo/digital-interface-of-financial-data-over-scaffold-grid-overlay/597e8559dab6b56cab7ae79439af9fdc/"
style="text-decoration: none; font-size: 10px; margin: 0;"
>
<img src="https://pikwizard.com/pw/medium/597e8559dab6b56cab7ae79439af9fdc.jpg" style="margin: 0; width: 100%;" alt="" />
<p style="font-size: 12px; margin: 0;">PikWizard</p>
</a>
</span>
</span>
Free (free of charge)
Free for personal and commercial use.
Author: Awesome Content
Similar Free Stock Images

Premium


Premium


Premium


Premium


Premium


Premium


Premium


Premium


Premium


Premium


Premium


Premium


Premium


Premium


Premium


Premium


Premium


Premium


Premium


Premium


Premium


Premium


Premium


Premium