
- Home >
- Stock Photos >
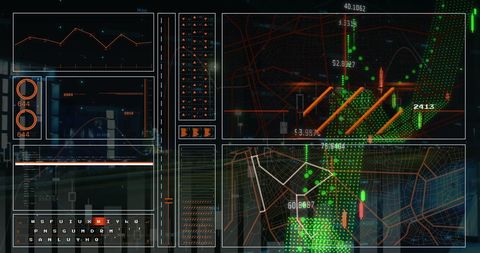
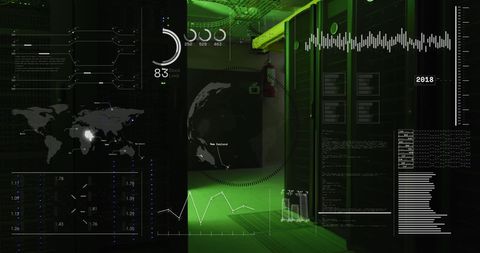
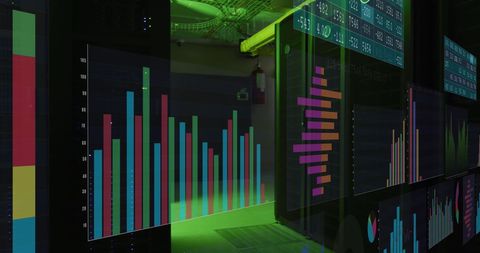
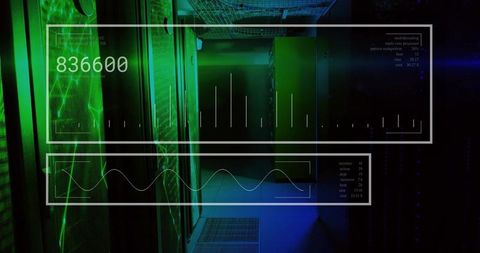
- Digital Interface Overlay on Data Screens in Server Room
Digital Interface Overlay on Data Screens in Server Room Image
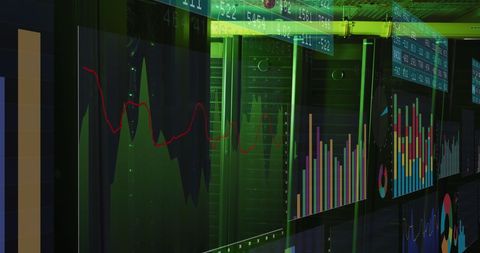
Abstract representation of digital data overlapping with server stations. Ideal for showcasing themes about business analytics, information technology transformation, or cyber security strategies.
Powered by 


downloads
Tags:
More
Credit Photo
If you would like to credit the Photo, here are some ways you can do so
Text Link
photo Link
<span class="text-link">
<span>
<a target="_blank" href=https://pikwizard.com/photo/digital-interface-overlay-on-data-screens-in-server-room/e91da7fff4f67f15e968adb6c0309ac3/>PikWizard</a>
</span>
</span>
<span class="image-link">
<span
style="margin: 0 0 20px 0; display: inline-block; vertical-align: middle; width: 100%;"
>
<a
target="_blank"
href="https://pikwizard.com/photo/digital-interface-overlay-on-data-screens-in-server-room/e91da7fff4f67f15e968adb6c0309ac3/"
style="text-decoration: none; font-size: 10px; margin: 0;"
>
<img src="https://pikwizard.com/pw/medium/e91da7fff4f67f15e968adb6c0309ac3.jpg" style="margin: 0; width: 100%;" alt="" />
<p style="font-size: 12px; margin: 0;">PikWizard</p>
</a>
</span>
</span>
Free (free of charge)
Free for personal and commercial use.
Author: Creative Art
Similar Free Stock Images

Premium


Premium
Premium


Premium


Premium


Premium


Premium


Premium

Premium

Premium


Premium


Premium


Premium


Premium


Premium


Premium


Premium

Premium


Premium


Premium


Premium


Premium


Premium


Premium


Premium


Explore More Free Stock Images