
- Home >
- Stock Photos >
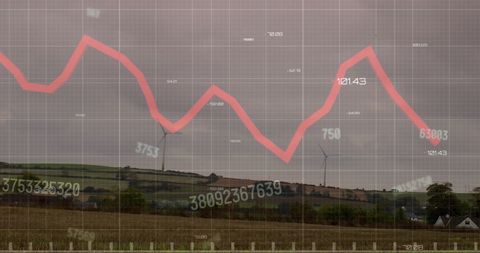
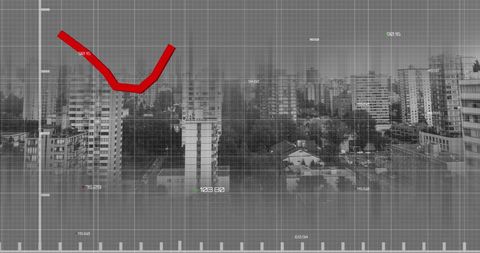
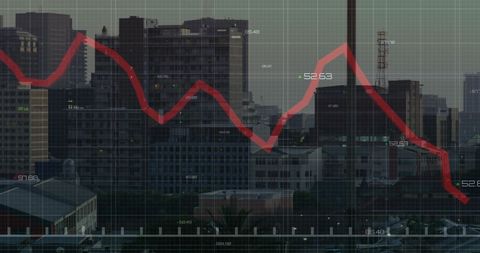
- Digital Interface Overlay Showing Economic Decline
Digital Interface Overlay Showing Economic Decline Image

Illustration showing a declining red graph superimposed on a cityscape, symbolizing economic downturn or stock market impact within an urban environment. Useful for finance-related publications, articles on business strategies, and analyses of economic trends affecting urban areas.
Powered by  - Get 15% off with code: PIKWIZARD15


downloads
Tags:
More
Credit Photo
If you would like to credit the Photo, here are some ways you can do so
Text Link
photo Link
<span class="text-link">
<span>
<a target="_blank" href=https://pikwizard.com/photo/digital-interface-overlay-showing-economic-decline/9a3a4096cf10d8d3fda6f9a706115e11/>PikWizard</a>
</span>
</span>
<span class="image-link">
<span
style="margin: 0 0 20px 0; display: inline-block; vertical-align: middle; width: 100%;"
>
<a
target="_blank"
href="https://pikwizard.com/photo/digital-interface-overlay-showing-economic-decline/9a3a4096cf10d8d3fda6f9a706115e11/"
style="text-decoration: none; font-size: 10px; margin: 0;"
>
<img src="https://pikwizard.com/pw/medium/9a3a4096cf10d8d3fda6f9a706115e11.jpg" style="margin: 0; width: 100%;" alt="" />
<p style="font-size: 12px; margin: 0;">PikWizard</p>
</a>
</span>
</span>
Free (free of charge)
Free for personal and commercial use.
Author: People Creations
Similar Free Stock Images

Premium


Premium

Premium


Premium


Premium


Premium

Premium

Premium


Premium


Premium


Premium


Premium

Premium

Premium


Premium


Premium


Premium


Premium


Premium


Premium


Premium

Premium


Premium


Premium


Premium


Explore More Free Stock Images