
- Home >
- Stock Photos >
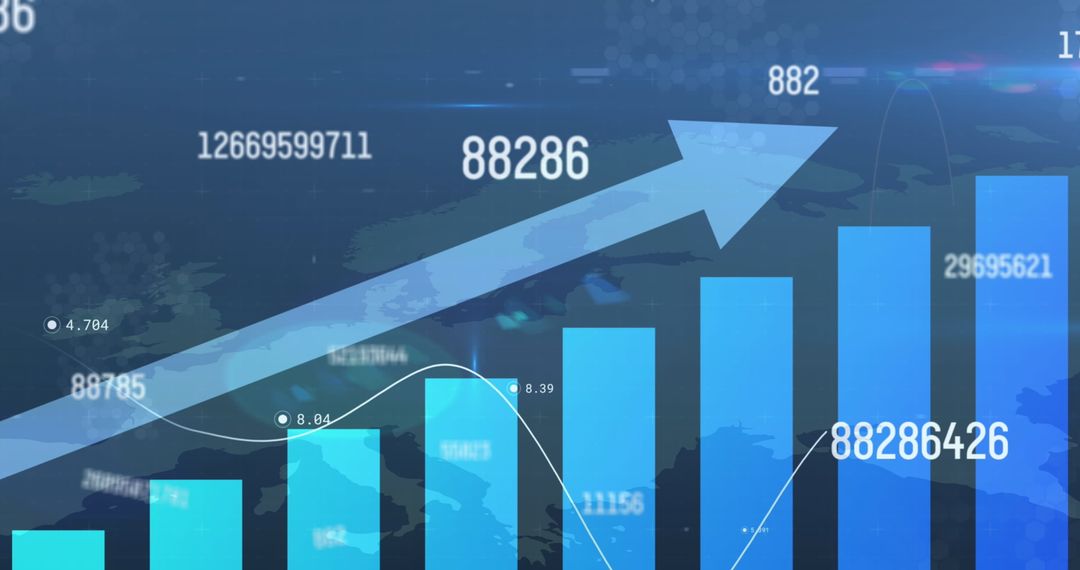
- Digital Interface Overlaying City Buildings with Rising Graphs
Digital Interface Overlaying City Buildings with Rising Graphs Image

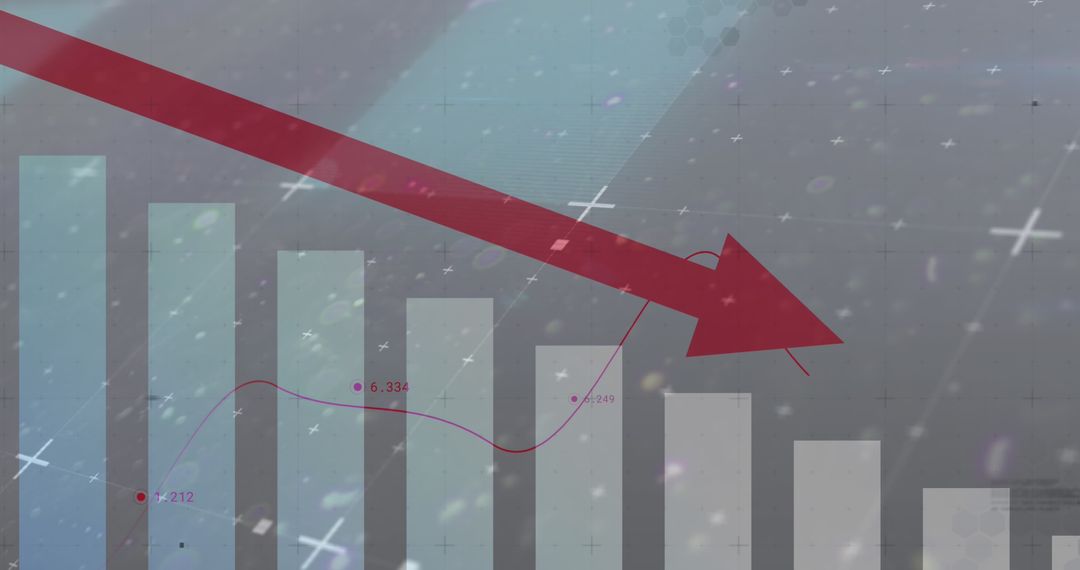
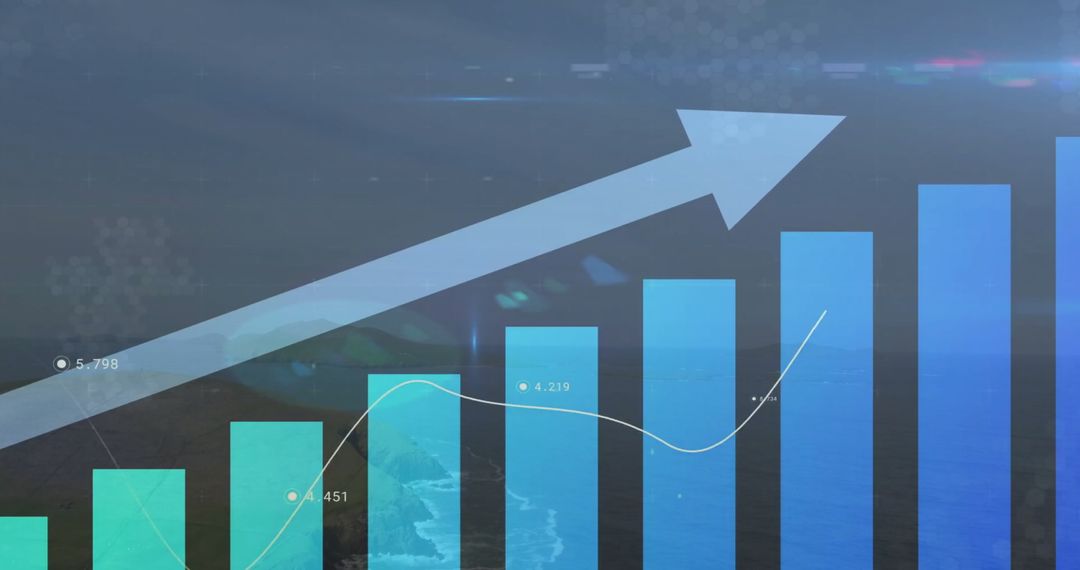
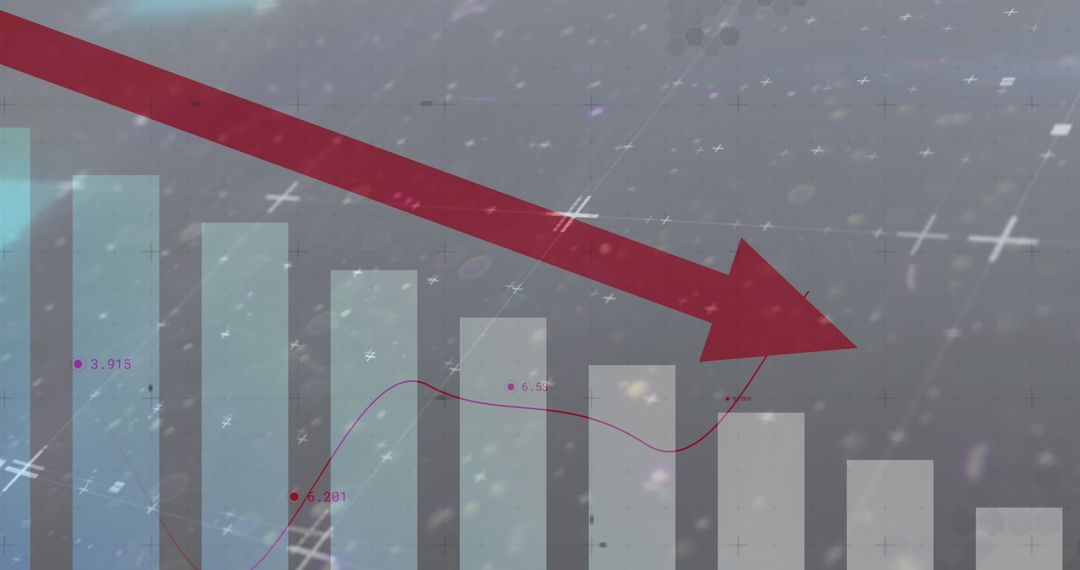
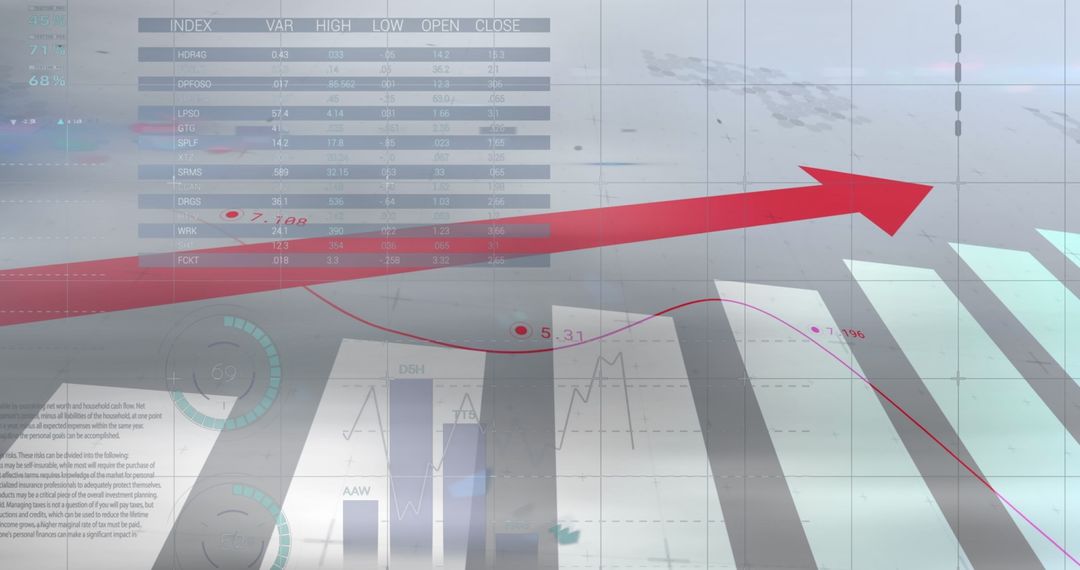
This image depicts a digital interface with rising bar graphs overlaying skyscrapers, symbolizing business growth and economic prediction. The graphical elements and computer interface reflect advancements in data technology and finance sectors, making it useful for publications on future technology, economic forecasts, or corporate presentations.
Powered by  - Get 15% off with code: PIKWIZARD15


2
downloads
downloads
Tags:
More
Credit Photo
If you would like to credit the Photo, here are some ways you can do so
Text Link
photo Link
<span class="text-link">
<span>
<a target="_blank" href=https://pikwizard.com/photo/digital-interface-overlaying-city-buildings-with-rising-graphs/f51757b819e7967abab6966aae542cd9/>PikWizard</a>
</span>
</span>
<span class="image-link">
<span
style="margin: 0 0 20px 0; display: inline-block; vertical-align: middle; width: 100%;"
>
<a
target="_blank"
href="https://pikwizard.com/photo/digital-interface-overlaying-city-buildings-with-rising-graphs/f51757b819e7967abab6966aae542cd9/"
style="text-decoration: none; font-size: 10px; margin: 0;"
>
<img src="https://pikwizard.com/pw/medium/f51757b819e7967abab6966aae542cd9.jpg" style="margin: 0; width: 100%;" alt="" />
<p style="font-size: 12px; margin: 0;">PikWizard</p>
</a>
</span>
</span>
Free (free of charge)
Free for personal and commercial use.
Author: People Creations
Similar Free Stock Images

Premium


Premium


Premium


Premium


Premium


Premium


Premium


Premium


Premium


Premium


Premium


Premium


Premium


Premium


Premium


Premium


Premium


Premium


Premium


Premium


Premium


Premium


Premium


Premium

