
- Home >
- Stock Photos >
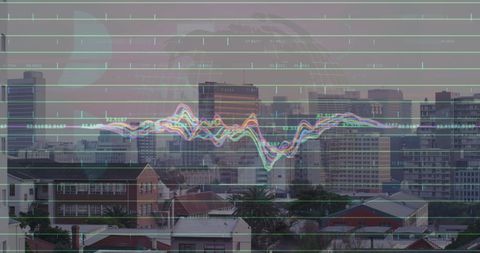
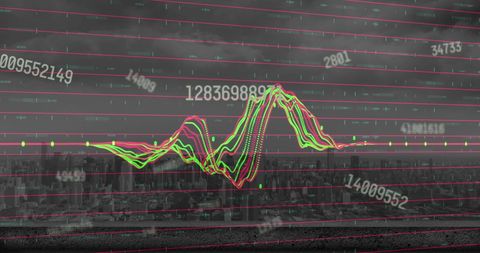
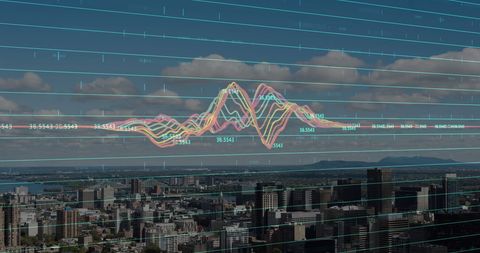
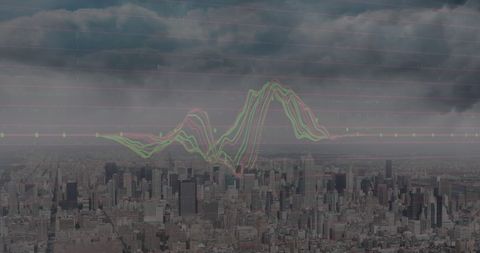
- Digital Interface Overlaying Urban Financial Data Visualization
Digital Interface Overlaying Urban Financial Data Visualization Image
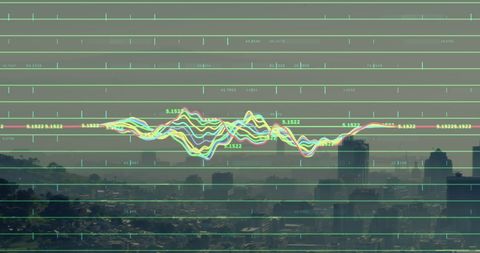
Colorful digital graph overlays across a city skyline visualize financial data and economic trends, suggesting advancements in global computing and analytics. Perfect for illustrating articles about business growth, investment strategies, or the impact of technology on urban environments.
Powered by 


downloads
Tags:
More
Credit Photo
If you would like to credit the Photo, here are some ways you can do so
Text Link
photo Link
<span class="text-link">
<span>
<a target="_blank" href=https://pikwizard.com/photo/digital-interface-overlaying-urban-financial-data-visualization/93707ec8ce012e5ebb3bccbe7f5f546d/>PikWizard</a>
</span>
</span>
<span class="image-link">
<span
style="margin: 0 0 20px 0; display: inline-block; vertical-align: middle; width: 100%;"
>
<a
target="_blank"
href="https://pikwizard.com/photo/digital-interface-overlaying-urban-financial-data-visualization/93707ec8ce012e5ebb3bccbe7f5f546d/"
style="text-decoration: none; font-size: 10px; margin: 0;"
>
<img src="https://pikwizard.com/pw/medium/93707ec8ce012e5ebb3bccbe7f5f546d.jpg" style="margin: 0; width: 100%;" alt="" />
<p style="font-size: 12px; margin: 0;">PikWizard</p>
</a>
</span>
</span>
Free (free of charge)
Free for personal and commercial use.
Author: Creative Art
Similar Free Stock Images

Premium


Premium

Premium

Premium


Premium


Premium


Premium


Premium

Premium

Premium


Premium


Premium

Premium

Premium


Premium

Premium


Premium


Premium


Premium


Premium

Premium


Premium

Premium

Premium


Premium


Explore More Free Stock Images