
- Home >
- Stock Photos >
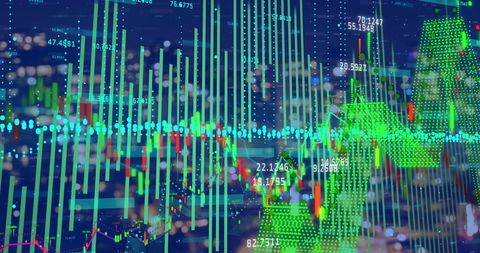
- Digital Interface Showcasing Financial Data and Trade Analytics
Digital Interface Showcasing Financial Data and Trade Analytics Image
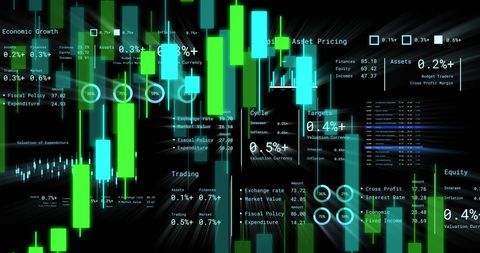
Digital interface image displays various financial metrics, trade analytics, and economic statistics against a stark modern background. Green and blue digital candlesticks represent market charts integral for forex or stock trading Lane abierto.views may employ this dynamically styled financial visual to illustrate concepts in international economics, market forecasting, finance technology, or currency trading methodologies.
Powered by 


downloads
Tags:
More
Credit Photo
If you would like to credit the Photo, here are some ways you can do so
Text Link
photo Link
<span class="text-link">
<span>
<a target="_blank" href=https://pikwizard.com/photo/digital-interface-showcasing-financial-data-and-trade-analytics/3eaa5b1a2470e16f5f58005b1f567a1b/>PikWizard</a>
</span>
</span>
<span class="image-link">
<span
style="margin: 0 0 20px 0; display: inline-block; vertical-align: middle; width: 100%;"
>
<a
target="_blank"
href="https://pikwizard.com/photo/digital-interface-showcasing-financial-data-and-trade-analytics/3eaa5b1a2470e16f5f58005b1f567a1b/"
style="text-decoration: none; font-size: 10px; margin: 0;"
>
<img src="https://pikwizard.com/pw/medium/3eaa5b1a2470e16f5f58005b1f567a1b.jpg" style="margin: 0; width: 100%;" alt="" />
<p style="font-size: 12px; margin: 0;">PikWizard</p>
</a>
</span>
</span>
Free (free of charge)
Free for personal and commercial use.
Author: Creative Art
Similar Free Stock Images

Premium


Premium


Premium

Premium


Premium

Premium


Premium

Premium


Premium


Premium

Premium


Premium


Premium


Premium


Premium

Premium


Premium


Premium


Premium


Premium


Premium

Premium


Premium

Premium


Premium


Explore More Free Stock Images