
- Home >
- Stock Photos >
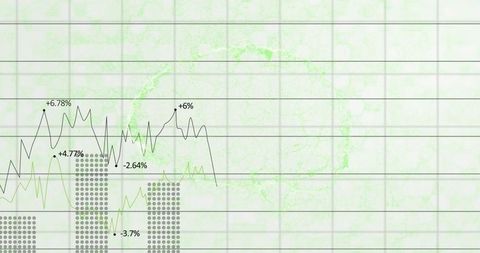
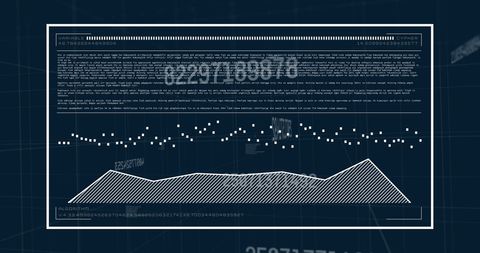
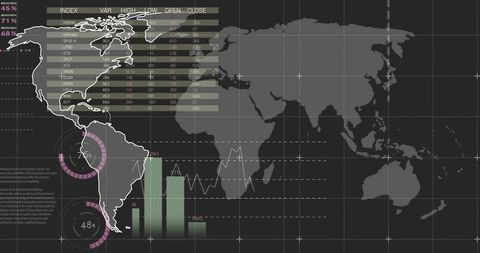
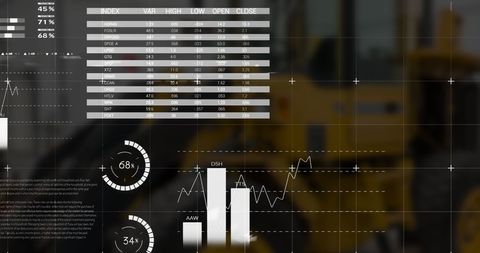
- Digital Interface Showing Data Analytics with Graphs and Charts
Digital Interface Showing Data Analytics with Graphs and Charts Image

Graphic depicting a digital interface with various charts, graphs, and statistical data. Useful for illustrating concepts related to business analysis, data processing in IT, or any scenario requiring an advanced computing or analytic setting. Suitable for articles about digital transformation, software solutions, or technological advancements.
Powered by 


downloads
Tags:
More
Credit Photo
If you would like to credit the Photo, here are some ways you can do so
Text Link
photo Link
<span class="text-link">
<span>
<a target="_blank" href=https://pikwizard.com/photo/digital-interface-showing-data-analytics-with-graphs-and-charts/abc7f14f222afb09c005a675c6f26100/>PikWizard</a>
</span>
</span>
<span class="image-link">
<span
style="margin: 0 0 20px 0; display: inline-block; vertical-align: middle; width: 100%;"
>
<a
target="_blank"
href="https://pikwizard.com/photo/digital-interface-showing-data-analytics-with-graphs-and-charts/abc7f14f222afb09c005a675c6f26100/"
style="text-decoration: none; font-size: 10px; margin: 0;"
>
<img src="https://pikwizard.com/pw/medium/abc7f14f222afb09c005a675c6f26100.jpg" style="margin: 0; width: 100%;" alt="" />
<p style="font-size: 12px; margin: 0;">PikWizard</p>
</a>
</span>
</span>
Free (free of charge)
Free for personal and commercial use.
Author: Creative Art
Similar Free Stock Images

Premium


Premium


Premium


Premium

Premium


Premium

Premium


Premium


Premium


Premium

Premium


Premium


Premium


Premium


Premium


Premium


Premium

Premium


Premium


Premium

Premium


Premium


Premium


Premium


Premium

Explore More Free Stock Images