- Home >
- Stock Photos >
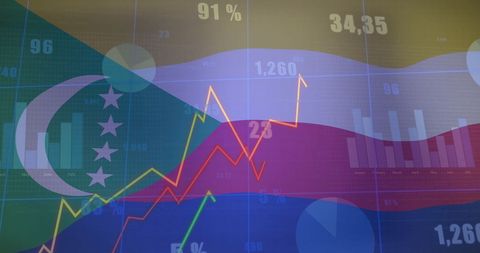
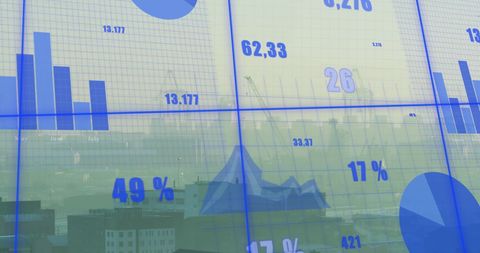
- Digital Interface Showing Data Visualization with Analytics Charts
Digital Interface Showing Data Visualization with Analytics Charts Image

Graphics depicting various types of charts and data metrics on a digital dashboard. This visual concept is suitable for use in presentations or educational material related to data analysis or business intelligence. It can also enhance websites, articles, or marketing materials focused on technology, data-driven decision-making, or financial markets.

downloads
Tags:
More
Credit Photo
If you would like to credit the Photo, here are some ways you can do so
Text Link
photo Link
<span class="text-link">
<span>
<a target="_blank" href=https://pikwizard.com/photo/digital-interface-showing-data-visualization-with-analytics-charts/69e0c78bbf598c9abb428780d3002df8/>PikWizard</a>
</span>
</span>
<span class="image-link">
<span
style="margin: 0 0 20px 0; display: inline-block; vertical-align: middle; width: 100%;"
>
<a
target="_blank"
href="https://pikwizard.com/photo/digital-interface-showing-data-visualization-with-analytics-charts/69e0c78bbf598c9abb428780d3002df8/"
style="text-decoration: none; font-size: 10px; margin: 0;"
>
<img src="https://pikwizard.com/pw/medium/69e0c78bbf598c9abb428780d3002df8.jpg" style="margin: 0; width: 100%;" alt="" />
<p style="font-size: 12px; margin: 0;">PikWizard</p>
</a>
</span>
</span>
Free (free of charge)
Free for personal and commercial use.
Author: People Creations