
- Home >
- Stock Photos >
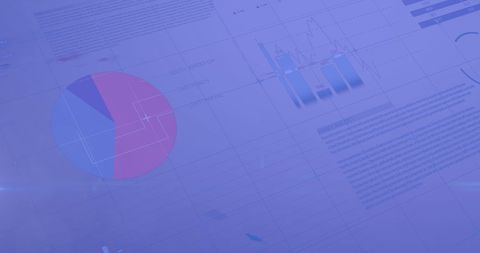
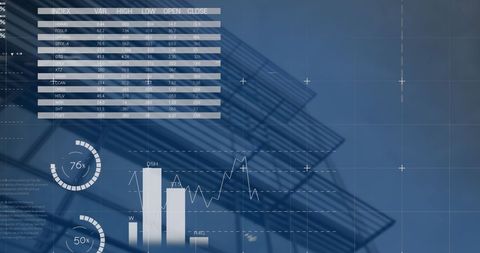
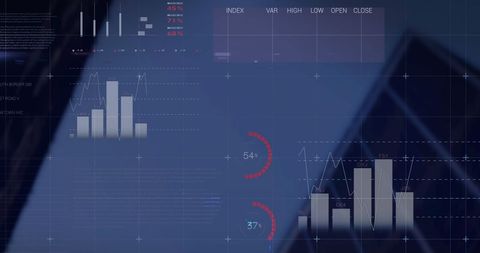
- Digital Interface Showing Financial Charts and Data Analysis
Digital Interface Showing Financial Charts and Data Analysis Image

Abstract representation of financial charts and data on a digital interface. The visuals suggest themes of data processing, connection, and global technology services. Useful for illustrating articles on finance, digital marketing, technology trends, and global communications. Ideal for use in financial presentations, reports, and digital communication workshops, highlighting a modern approach to business analytics.
Powered by 


downloads
Tags:
More
Credit Photo
If you would like to credit the Photo, here are some ways you can do so
Text Link
photo Link
<span class="text-link">
<span>
<a target="_blank" href=https://pikwizard.com/photo/digital-interface-showing-financial-charts-and-data-analysis/64fa3c166edafd49edd36c5cd28d9730/>PikWizard</a>
</span>
</span>
<span class="image-link">
<span
style="margin: 0 0 20px 0; display: inline-block; vertical-align: middle; width: 100%;"
>
<a
target="_blank"
href="https://pikwizard.com/photo/digital-interface-showing-financial-charts-and-data-analysis/64fa3c166edafd49edd36c5cd28d9730/"
style="text-decoration: none; font-size: 10px; margin: 0;"
>
<img src="https://pikwizard.com/pw/medium/64fa3c166edafd49edd36c5cd28d9730.jpg" style="margin: 0; width: 100%;" alt="" />
<p style="font-size: 12px; margin: 0;">PikWizard</p>
</a>
</span>
</span>
Free (free of charge)
Free for personal and commercial use.
Author: Awesome Content
Similar Free Stock Images

Premium


Premium


Premium

Premium

Premium


Premium


Premium

Premium


Premium

Premium


Premium


Premium


Premium

Premium

Premium


Premium


Premium


Premium


Premium


Premium


Premium


Premium

Premium


Premium


Premium

Explore More Free Stock Images