- Home >
- Stock Photos >
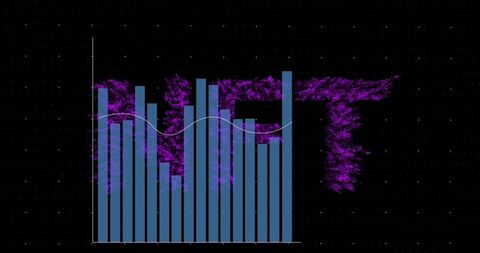
- Digital Interface with Abstract Data Visualizations and Patterns
Digital Interface with Abstract Data Visualizations and Patterns Image

The image depicts a digital interface featuring abstract patterns overlaying data visualizations, suggesting technological advancement and analytics. This concept can be effectively used in presentations or educational materials focusing on tech innovation, data science, or virtual environments.

downloads
Tags:
More
Credit Photo
If you would like to credit the Photo, here are some ways you can do so
Text Link
photo Link
<span class="text-link">
<span>
<a target="_blank" href=https://pikwizard.com/photo/digital-interface-with-abstract-data-visualizations-and-patterns/bcb230a8a1ccecef6a59f51048dabc70/>PikWizard</a>
</span>
</span>
<span class="image-link">
<span
style="margin: 0 0 20px 0; display: inline-block; vertical-align: middle; width: 100%;"
>
<a
target="_blank"
href="https://pikwizard.com/photo/digital-interface-with-abstract-data-visualizations-and-patterns/bcb230a8a1ccecef6a59f51048dabc70/"
style="text-decoration: none; font-size: 10px; margin: 0;"
>
<img src="https://pikwizard.com/pw/medium/bcb230a8a1ccecef6a59f51048dabc70.jpg" style="margin: 0; width: 100%;" alt="" />
<p style="font-size: 12px; margin: 0;">PikWizard</p>
</a>
</span>
</span>
Free (free of charge)
Free for personal and commercial use.
Author: Creative Art