1. Home > 
  2. Stock Photos > 
  3. Digital Interface with Business Analytics Graph and Sci-Fi Display

Digital Interface with Business Analytics Graph and Sci-Fi Display Image

Digital Interface with Business Analytics Graph and Sci-Fi Display

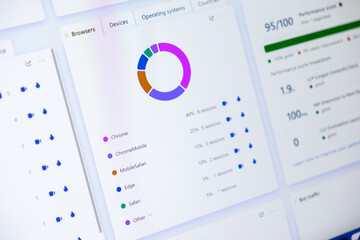
Digital interface combines business analytics graph with a science fiction style spinning display over a blue grid. Ideal for presentations on technology trends, data analysis, and futuristic business concepts, this visual is effective for enhancing tech-driven branding and conveying innovation.

Powered by Adobe logo
Futuristic pie chart graphic for big data analytics and market segmentation. Digital dashboard concept with copy space. - Powered by AdobeDynamic digital dashboard showcasing financial analytics and task completion on futuristic transparent interface, driving business growth and efficiency. - Powered by AdobeFuturistic digital graph displayed on a tablet, symbolizing financial growth and business analytics in a technological context. - Powered by AdobeBusinessman s finger touching a glowing digital interface with business growth icons and city skyline at dusk symbolizing success and future planning - Powered by AdobeHand pointing at glowing digital data analytics screen with charts and graphs - Powered by Adobe

Credit Photo

If you would like to credit the Photo, here are some ways you can do so

Free (free of charge)

Free for personal and commercial use.

Author: Authentic Images

Similar Free Stock Images

Loading...
Abstract Financial Graph with Glowing Node on Grid Background
Premium
Business analytics concept with person analyzing upward financial growth on laptop using digital charts and arrows on futuristic background.
Digital Cardiograph on Black Background in Colorful Display
Financial Data Graph Rendering Global Market Trends
Dynamic Financial Graph with Wavy Data Line over Navy Background
Financial Growth Graph on Green Digital Grid Background
Premium
Man accessing data analytics dashboard with modern interface for business insights
Falling Line Graph on Navy Background Illustrating Economic Decline
Futuristic Financial Data Interface with Digital Waveform
Digital Financial Data on Server with Stock Market Graph
Global Economy Displaying Growth Trends with Ukraine-NATO Financial Outlook
Premium
Digital dashboard data analysis business graph technical chart financial report modern office uptrend analytics technology professional
Dynamic Stagflation Concept Displaying Economic Burdens
Stock Market Data Surging Upward on Digital Display
Slumpflation Concept with Graph and Digital Display
Digital Network Connections and Data Processing Illustrative Graphic
Premium
A futuristic transparent digital interface displaying charts, graphs, and data analytics with a hand interacting with it.
European Market Data Overlay with EU Flag and Financial Graphs
Abstract Digital Finance Chart Showing Fluctuating Graph Lines
Circular Data Visualization with Financial Analytics
Abstract Digital Radar Scanning Data Processing
Premium
Doctor pointing at rising bar chart with medical icons and growth arrows, representing healthcare analytics, hospital performance improvement and medical business success strategy
Digital Data Prozessing with Global Interface Design
Futuristic Financial Chart with Declining Trend
Financial Data Graphics Over World Map in Digital Style
Futuristic Globe and Code Background Display
Premium
Business dashboard Data analysis on a laptop with charts and graphs. strategic business intelligence, and financial marketing report KPI monitoring, and insights.
Digital Data Visualization with Green Graph and Scanning Beams
Dynamic Financial Data on Digital Screen
Digital Data Processing with Graph and Grid Technology Interface
Digital Stock Market Graph Red Trendline on Green Background
Premium
A professional uses stylus on digital interface to manage business team, analyze strategy,review data.This image represents modern team management, HR, communication, organization planning technology.
Glowing Data Lines on Financial Graph Grid Background
Abstract DNA Helix Digital Network
Premium
Businessman using digital dashboard with holographic graphs and charts on laptop and stylus representing data analysis financial report business strategy and modern technology for decision making
Rising Financial Graph on Dark Grid Background
Premium
Marketer using digital marketing dashboard with charts, pie graphs, organization chart, and performance data. Concept of business analytics and strategic planning.
Dynamic Financial Chart with Data Points on Red Grid Background
Red Graph Showing Downward Trend on Digital Grid
Digital Financial Data Display with Graph and Grid
Digital Interface with Global Financial Graphs Background
Premium
Businessman analyzing data on laptop with virtual dashboard. Global business technology, Big Data analytics, and Business Intelligence (BI) for market strategy.
Innovative Data Analysis with Dynamic Line Graph and Digital Elements
Futuristic Graph with Digital Globe Symbolizing Global Technology Connections
Stagflation Concept with Digital Financial Graphs
Slumpflation Concept on Digital Financial Screen
Premium
Manages digital data using a tablet showing analytics graphs and information for business intelligence application on an interface design
Futuristic Digital Interface with Scanning Data Display
Financial Graph Displayed Over City Skyline at Sunset
Analyzing Stock Market Trends with Dynamic Graphs and Data
Financial Data Visualization with Scope Scanning Effect
Premium
business growth analytics — tablet with upward graph, arrow and glowing success interface
Fingerprint Authentication and Secure Data Interface
Digital Financial Data Analytics and Trend Graphs
Futuristic Digital Data Analysis with Neon Interface
Global Networking Concept with 6G Technology Display
Premium
Data Analyst Interacting With Futuristic Holographic Market Charts
Dynamic Financial Graphs Overlaying Modern Cityscape
Line Graph Illustrating Data Trend on Green Digital Background
Financial Data Analysis with Futuristic Technology Interface
Abstract Representation of Financial Data Processing
Premium
Businessman using AI on a smartphone interacting with a digital interface for business intelligence and data analysis
Digital Data Processing with Chart in Futuristic Interface
Line Graphs on Digital Background Show Financial Data Trends
Abstract Digital Waves on Blue Background with Grid
Neon Green Electrocardiogram Wave on Black Background
Futuristic Data Analytics Over Technical Blueprint Design
Digital Financial Graph Over Violet Background in Abstract Style
Digital Financial Graph on Green Background Showing Rising Trends
Dynamic Financial Graph in Virtual Red Grid Background
Premium
Businessman using artificial intelligence to boost productivity and performance, with upward arrow graph and digital data interface, symbolizing AI-driven growth, innovation, and future success.
Premium
Businessman interacts with digital flowchart and data graph
Slumpflation Concept on Armenian Flag Background
Stagflation with Polish Economic Data Visualization
Financial Graph Analysis on Green Grid Background
Stagflation Concept Overlay on Financial Graphs with Digital Data
Stagflation Concept with Red Graph Overlay on Cityscape
Data Trends and Analysis on 3D Digital Grid
Abstract Digital Waveform and Data Visualization on Dark Background
Futuristic Digital Network Interface With Interactive Wave Patterns
Premium
Dynamic stock market chart with vibrant blue and pink bars showing upward trend and financial data visualization in a futuristic digital interface
Premium
Man in suit works on laptop. Digital interface shows growing graph and data points. Person uses computer for business analytics and strategy planning.
Digital Finance Chart Overlaying Globe Background
Futuristic Global Finance Chart with Rotating Globe Animation
Neon Round Scanner with Statistical Data Display
Futuristic Data Visualization and Graph Analytics on Green Interface
Digital Financial Data and AI Illustration Networking Globally
Glowing Financial Graph of Stock Market Trends on Digital Screen
Financial Data Analysis and Digital Interface Concept
Holographic Global Data Graphs on Digital Grid Background
Premium
Futuristic holographic data hub with glowing blue towers and floating analytical dashboards displaying charts and graphs.
Global Data Analytics Over World Map with Numeric Statistics
Financial Stock Market Data Visualization with Declining Trends
Dynamic Data Analysis on Digital Graph, Technology Background
Graph Lines Portraying Financial Data Trends
Glowing Blue Cardiograph on Black Background Interface
Glowing Cardiology Graph on Dark Background
Premium
Abstract representation of a rising graph on a digital interface with a world map backdrop, symbolizing growth
Digital Graph Display with Dynamic Flux on Purple Background
Dynamic Financial Graph on Luminous Green Background
Dynamic Financial Graph on Purple Background
Digital Financial Data Analyzing Over Circular Grid Display
Digital Interface Showing Global Business Data Analytics
Stagflation Concept With Latvia Flag and Chart
Stagflation Concept Overlaid on Palestinian Flag Background
Abstract Financial Graph with Rising Waves on Red Gradient
Premium
Futuristic data dashboard with multiple neon blue and orange screens displaying charts graphs and analytics in a high tech digital interface for business and technology concepts
Premium
Man in suit touching futuristic digital interface with charts business technology
Digital DNA Strand Overlaid with Scientific Data Patterns
Futuristic Display with Data Scan and Holographic Elements
Retro Neon Synthwave Digital Arena with Grid Lines
Futuristic Financial Graph with Data Overlays in Blue Holographic Style
Dynamic Financial Data Visualizations on Grid Interface
Digital Globe and Data Chart Revolutionizing Global Business Concepts
Dynamic Financial Data Waves in Digital Cyber World
Colorful Data Visualization on Dark Background
Premium
Futuristic business intelligence dashboard interface with financial data visualization for
Premium
Digital HR system showing employee KPI data, team performance metrics and productivity dashboards used by organizations for workforce evaluation and human resource data driven decision making
Digital Graph Displaying Dynamic Data Analysis
Financial Data Processing with Green Digital Graph in Action
Dynamic Financial Graphs Overlaying Urban Skyline
Abstract Circuit Brain with Financial Growth Concept
Premium
A business professional analyzing futuristic digital graphs and analytics dashboards on a tablet, showcasing data visualization, financial growth, and business intelligence in a modern tech environmen
Digital Graphs and Data Visualization on Green Background
Futuristic Digital Graph Showing Data Trends on Analytic Interface