- Home >
- Stock Photos >
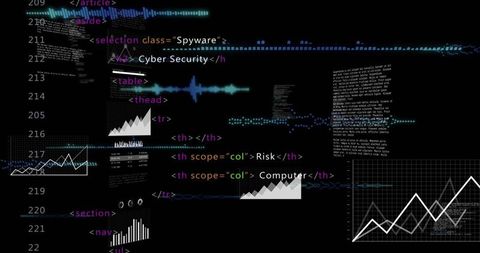
- Digital Interface with Data Analysis and Code in Console
Digital Interface with Data Analysis and Code in Console Image
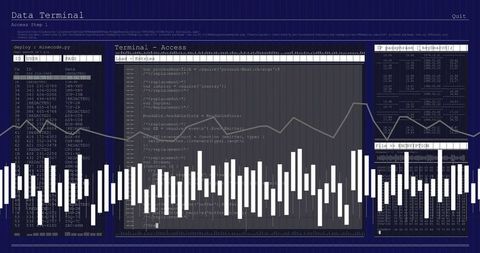
This visually engaging representation shows a digital interface including code and data analysis in multiple console windows. Waveforms overlay over the background, symbolizing signal analysis and encryption data. Ideal for use in cybersecurity lectures, data technology courses, programming and tech seminars, innovative multimedia designs, or social media posts highlighting tech topics.

downloads
Tags:
More
Credit Photo
If you would like to credit the Photo, here are some ways you can do so
Text Link
photo Link
<span class="text-link">
<span>
<a target="_blank" href=https://pikwizard.com/photo/digital-interface-with-data-analysis-and-code-in-console/54508d345248b378b2cfee095dfe291e/>PikWizard</a>
</span>
</span>
<span class="image-link">
<span
style="margin: 0 0 20px 0; display: inline-block; vertical-align: middle; width: 100%;"
>
<a
target="_blank"
href="https://pikwizard.com/photo/digital-interface-with-data-analysis-and-code-in-console/54508d345248b378b2cfee095dfe291e/"
style="text-decoration: none; font-size: 10px; margin: 0;"
>
<img src="https://pikwizard.com/pw/medium/54508d345248b378b2cfee095dfe291e.jpg" style="margin: 0; width: 100%;" alt="" />
<p style="font-size: 12px; margin: 0;">PikWizard</p>
</a>
</span>
</span>
Free (free of charge)
Free for personal and commercial use.
Author: People Creations