1. Home > 
  2. Stock Photos > 
  3. Digital Interface with Data Analytics and Processing Visuals

Digital Interface with Data Analytics and Processing Visuals Image

Digital Interface with Data Analytics and Processing Visuals

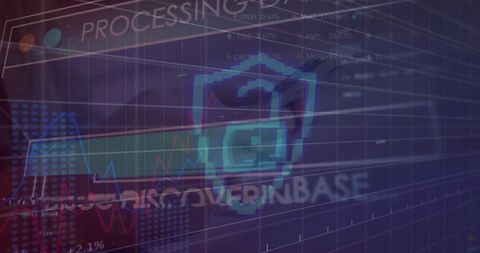
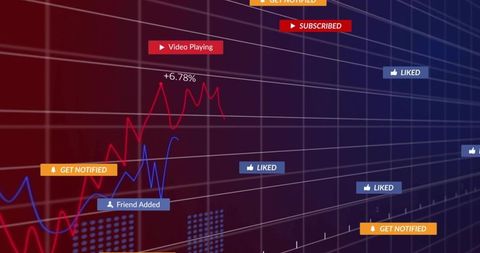
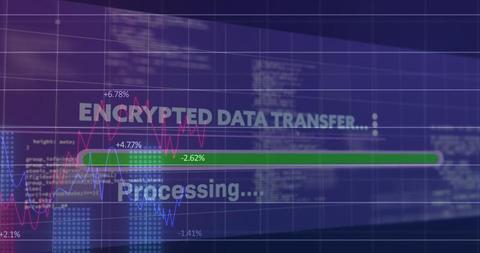
This digital representation features graphs and processing bars over a grid interface, relevant in technology and data analytics contexts. Perfect for conveying concepts of data analysis, connectivity, and technological progress. Ideal for technology presentations, articles on digital innovation, or textures in design projects focusing on digital advancement.

Powered by Adobe logo
Glowing data streams flow into a digital brain on a dark background symbolizing artificial intelligence learning connectivity knowledge transfer and the fusion of human thought with technology
 - Powered by AdobeData anlytics, AI and database management technology with global internet network connection. Connecting with cloud server and data center, technology background. data science and engineering - Powered by AdobeAsian Woman with Glowing Blue Holographic Displays in Dark Environment futuristic interface user data processing digital information hud projection - Powered by AdobeBusinessman using AI technology on a smartphone with digital interface and data analysis for business innovation and automation - Powered by AdobeDigital Business Process Optimization - Powered by Adobe

Credit Photo

If you would like to credit the Photo, here are some ways you can do so

Free (free of charge)

Free for personal and commercial use.

Author: Authentic Images

Similar Free Stock Images

Loading...
Dynamic Stock Market Indicators and Graphs on Blue Background
Premium
Engineer in hard hat, safety glasses controls industrial production process. Uses tablet to monitor digital data on holographic interface with graphs. Modern smart factory automation tech with
Financial Chart and Rotating Globe on Digital Grid Background
Digital Data Processing with Blue Interface Overlay
Encrypted Data Transfer and Digital Interface Technology
Digital Ruble Symbol with Data Graph Overlay
Premium
AI-powered data analysis displayed as holographic interfaces over industrial raw coal, symbolizing smart mining and efficiency.
Financial Data Visualization on Digital Grid
Financial Data Analysis Graph with Growing Trends
Digital Data Processing with Neon Frame Highlighting Trends
Dynamic Statistical Data Analysis on Digital Grid Network
Premium
AI logistic dashboard showing real-time supply chain data and transport analytics managed through smart virtual interface.
Digital Financial Graph Illustrating Stock Market Trends
Premium
ai, automation, artificial intelligence, Hand using a digital pen on a tablet with an AI interface overlay, representing artificial intelligence, automation, data analytics, and advanced technology.
Abstract Graphic Business Data Visualization
Abstract Digital Stock Market Analysis with Graphs
Abstract Digital Finance Background with Graphs and Data Visualization
Soundwave Visualization and Data Analysis on Digital Grid
Premium
Glowing data streams flow into a digital brain on a dark background symbolizing artificial intelligence learning connectivity knowledge transfer and the fusion of human thought with technology
Global Financial Data Analysis on Grid Background
Data Processing Overlaid on Graphs and Code in Digital Interface
Financial Data Processing in Digital Environment
Digital Financial Data Display Screen with Analytics
Premium
Artificial intelligence brain interface concept with digital hologram of AI neural network, futuristic data visualization representing deep learning, innovation technology, machine intelligence system
Digital Financial Data Analysis on Abstract Blue Background
Financial Data Graphic with Rising Trends on Digital Grid
Dynamic Financial Graph with Data Analysis Conceptual Background
Digital Graph and Data Analysis with Financial Growth Trends
Premium
Digital data processing hud interface showing futuristic network
Digital Analytics Graph with Futuristic 3D Interface
Subscriber Analytics Dashboard with Candlestick Charts and Line Graphs Showing 477,785 Subscribers
Red Declining Graph on Digital Grid Display Represents Falling Markets
Financial Data Visualization Overlay with City Skyline Background
Premium
Futuristic AI interface with circular digital circuitry representing machine learning intelligence data processing and the central role of artificial intelligence in modern innovation ecosystems.
Digital Data Processing Graph Interface with Progress Bar
Digital Data Transfer with Encrypted Processing Banner
Financial Data Display in Digital Grid Design
Digital Financial Data Interface on Green Background
Digital Data Integration and Social Media Metrics Visualized
Rising Graphs and Interactive Financial Data Analytics Background
Financial Growth Graph and Data Analytics Representation
Statistical Data and Trends Over Digital Grid Overlay
Digital Visualization Financial Data Growth Progressive Graph
Premium
Abstract 3D rendering of digital data flowing over a network of interconnected hexagons
Futuristic Interface Highlighting Encrypted Data Transfer
Analyzing Business Growth with Architectural Backdrop
Abstract Digital Stock Market Interface with Graphs and Data
Futuristic Data Chart with Digital Interface Elements
Premium
Explore the integration of artificial intelligence and data security in a sleek digital interface, highlighting innovative technology in modern analytics and user interaction. Gantry
Dynamic Stock Market Graph with Percentage Indicators
Abstract Financial Data Visualization with Graphs and Grid Background
Dynamic Display of Financial Market Data on Advanced Grid
Digital Data Analytics Growth Trend with Graphs
Premium
Man analyzes data with holographic interfaces on his laptop representing business intelligence for data driven decisions, insights and strategy.
Digital Data Processing with Cyber Security System Visualization
Dynamic Financial Graph Displaying Market Trends
Digital Visualization of Global Networking with Statistical Graphs
Abstract Digital Financial Data Graph Chart
Premium
Futuristic AI processor core glowing with neon circuits and advanced digital pathways representing high tech machine intelligence data processing cyber innovation and modern electronic connectivity
Dynamic Financial Trading Chart with Candlestick Graphs
Financial Charts with Blue and Red Lines and Digital Percent Indicators
Futuristic financial dashboard displaying layered stock charts, red and blue trend lines
Digital Financial Data Stream with Numeric Overlay
Digital Financial Data and Dynamic Stock Market Graphs
AI Face Identification with Digital Data Integration
Digital Data Processing and Encryption Interface Concept
Futuristic Data Transfer Concept with Digital Graphics
Dynamic Financial Data and Graphs on Digital Interface
Statistical Data on Orange Gradient Background
Dynamic Financial Data Charts on Dark Digital Background
Infinity Symbol Overlay with Stock Market Graphs and Trade Data
Digital Financial Data and Statistics Analyzing Concept
Global Financial Trends and Digital Data Visualization Concepts
Digital Screen Displaying Stock Market Index Data Trends
Colorful Data Analytics Bar Graphs on Digital Screen
Futuristic Data Recovery Concept on Digital Interface
Financial Data Processing with Digital Graph Overlay
Dynamic Forex Market Chart with Multiple Currencies and Growth Trends
Premium
Data foundation quality. ai transformation business powering intuitive data processing interface with futuristic network nodes and optimistic
Dynamic Financial Graphs with Holographic Elements on Orange Background
Digital Financial Data Analysis and Stock Market Charting
Futuristic Data Analysis and Statistical Interface Visualization
Dynamic Financial Data with Global Connections and Insights
Premium
Data analytics, AI and database management technology with global internet network connection. Connecting with cloud server and data center, technology background. data science and engineering
Financial Stock Market Trends Over Digital Grid Background
Stock Market Decline Data Analysis on Dark Grid Background
Global Financial Data Processing with Graphs and Charts on Dark Background
Futuristic Stock Market Graphs on Digital Display
Premium
Professional designing relational database structure tables and fields on digital interface, showing data connection, system architecture, and information management for modern business solutions.
Dynamic Financial Data Analytics with Stock Market Trends
Digital Trading Analysis with Graphs and Trendlines
Digital Financial Dashboard with Cyan Bar and Red Line Graph
Abstract data dashboard visualizing analytics with pulsing avatar icon and HUD elements
Premium
Tech-style interface with crypto dashboards and neural AI processing data
Abstract Financial Data and Numbers in Virtual Environment
Ukraine Crisis Financial Graphs Overlay
Digital Financial Data Analytics Wand Big Affect SEO Tools Commercial
Premium
Digital data processing on global network interface system
Premium
Modern laptop displays glowing data streams and icons. Digital connections link abstract icons for cloud storage and security. Futuristic tech interface shows information flow.
Dynamic Financial Charts with Blue Digital Interface
Abstract Financial Graph Display on Dark Background
Premium
Tech-style interface with crypto dashboards and neural AI processing data
Premium
Artificial Intelligence concept with data analytics dashboard, command prompt and digital brain interface, representing AI generation, machine learning, big data processing and automation tools.
Premium
Futuristic digital interface overlaying a cityscape, showcasing data visualization and global connections.
Stock Market Trends and Data Analysis over Digital Grid
Animated Financial Chart Depicting Stock Market Trends
Digital Financial Interface Over Cityscape
Data Analytics with Dynamic Global Market Trends on Screen
Premium
business professional interacting with AI-driven KPI dashboards and data analytics visuals, showcasing modern performance metrics, digital insights, and advanced business intelligence technology.
Dynamic Financial Graphs Illustrating Business Growth
Secure Data Analytics with Financial Graphs and Padlock Over Ukraine Flag
Digital Soundwaves with Data Graphs and Coding Elements
Stock Market Graph with Social Media Notifications Overlay
Premium
Control room with mining hinery screens and data monitoring
Digital Financial Graphs and Business Analytics on Blue Backdrop
Financial Data Analytics Over Digital Grid Screen
Dynamic Financial Data Chart on Green Gradient Background
Dynamic Financial Data Growth Chart Display
Premium
Person reviews digital compliance checklist on futuristic screen. Completing tasks on interactive interface, digital verification process for business goals and projects.
Financial Data Charts with Viewing Grid in Dark Perspective
Financial Data Processing on Digital Graph Displayed on Screen
Futuristic Data Visualization with Dynamic Graphs
Financial Analytics Dashboard with Growth Trends and Indicators
Premium
Hud interface showing digital data stream technology
Displaying Holographic 3D Red Bar Chart Tracing Red-Orange Line Graph on Analytics HUD