- Home >
- Stock Photos >
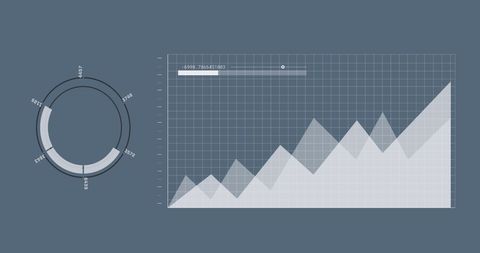
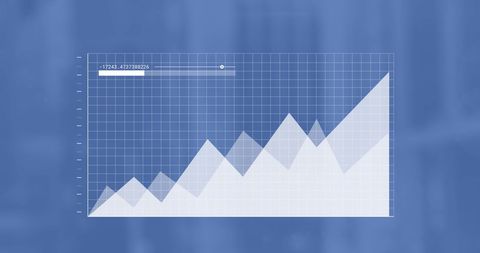
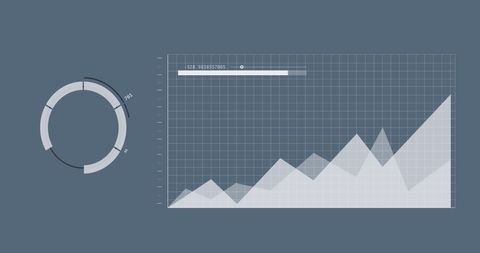
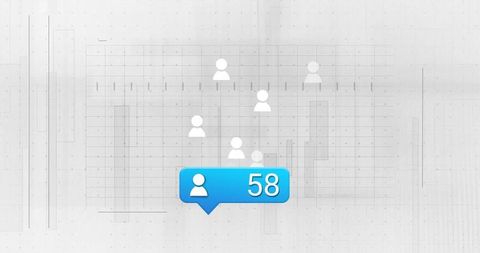
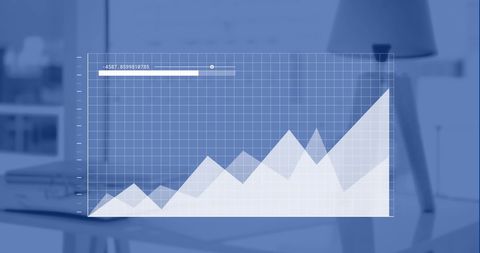
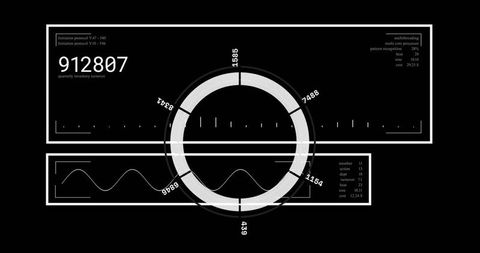
- Digital Interface with Data Chart and Progress Analysis Tools
Digital Interface with Data Chart and Progress Analysis Tools Image
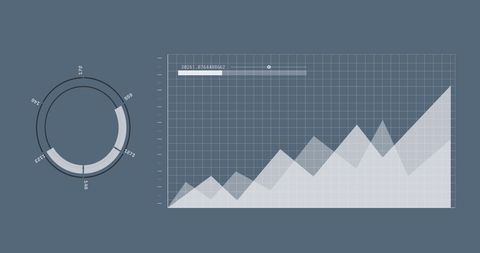
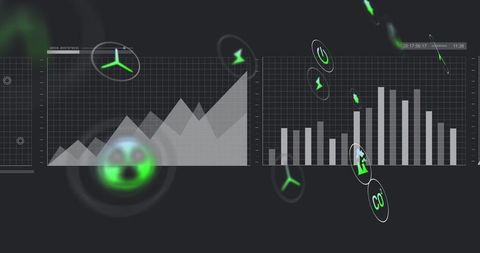
Digital tools display circular scanner analyzing data and a line graph on a neutral grey background. Useful for illustrating concepts in global communication, digital technology, and business analysis. Ideal for presentations, reports, or technology blog content showcasing analysis techniques and information processing methods.

downloads
Tags:
More
Credit Photo
If you would like to credit the Photo, here are some ways you can do so
Text Link
photo Link
<span class="text-link">
<span>
<a target="_blank" href=https://pikwizard.com/photo/digital-interface-with-data-chart-and-progress-analysis-tools/e78577ec23f72550360ae60d873cc93f/>PikWizard</a>
</span>
</span>
<span class="image-link">
<span
style="margin: 0 0 20px 0; display: inline-block; vertical-align: middle; width: 100%;"
>
<a
target="_blank"
href="https://pikwizard.com/photo/digital-interface-with-data-chart-and-progress-analysis-tools/e78577ec23f72550360ae60d873cc93f/"
style="text-decoration: none; font-size: 10px; margin: 0;"
>
<img src="https://pikwizard.com/pw/medium/e78577ec23f72550360ae60d873cc93f.jpg" style="margin: 0; width: 100%;" alt="" />
<p style="font-size: 12px; margin: 0;">PikWizard</p>
</a>
</span>
</span>
Free (free of charge)
Free for personal and commercial use.
Author: Authentic Images