
- Home >
- Stock Photos >
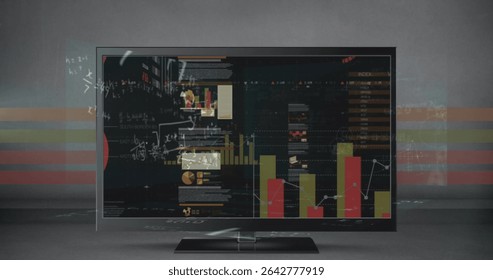
- Digital Interface with Data Charts and Graphs Illustration
Digital Interface with Data Charts and Graphs Illustration Image

Abstract representation of financial data visualization using digital charts and graphs overlaying neon backgrounds. Futuristic design showcases concepts related to global business analytics and technology advancements. Suitable for presentations, advertising, or educational purposes in fields like finance, economics, or data science, and for projects highlighting the intersection of technology and global market trends.
Powered by  - Get 15% off with code: PIKWIZARD15


downloads
Tags:
More
Credit Photo
If you would like to credit the Photo, here are some ways you can do so
Text Link
photo Link
<span class="text-link">
<span>
<a target="_blank" href=https://pikwizard.com/photo/digital-interface-with-data-charts-and-graphs-illustration/59af4a63f1e8a0dc6d575a05d560761d/>PikWizard</a>
</span>
</span>
<span class="image-link">
<span
style="margin: 0 0 20px 0; display: inline-block; vertical-align: middle; width: 100%;"
>
<a
target="_blank"
href="https://pikwizard.com/photo/digital-interface-with-data-charts-and-graphs-illustration/59af4a63f1e8a0dc6d575a05d560761d/"
style="text-decoration: none; font-size: 10px; margin: 0;"
>
<img src="https://pikwizard.com/pw/medium/59af4a63f1e8a0dc6d575a05d560761d.jpg" style="margin: 0; width: 100%;" alt="" />
<p style="font-size: 12px; margin: 0;">PikWizard</p>
</a>
</span>
</span>
Free (free of charge)
Free for personal and commercial use.
Author: Creative Art
Similar Free Stock Images

Premium


Premium


Premium


Premium


Premium


Premium


Premium


Premium

Premium


Premium


Premium


Premium


Premium

Premium


Premium


Premium


Premium


Premium


Premium


Premium


Premium

Premium


Premium


Premium


Premium


Explore More Free Stock Images