
- Home >
- Stock Photos >
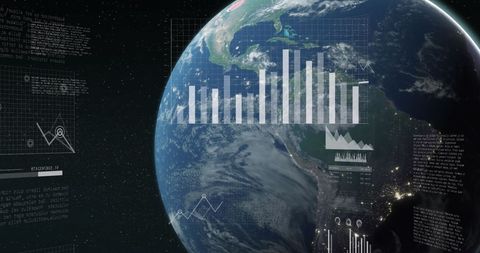
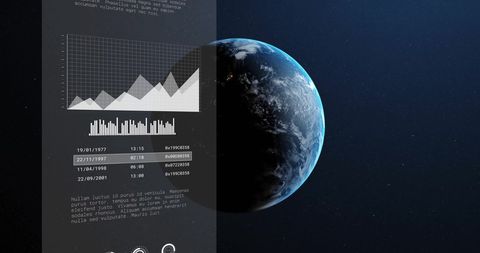
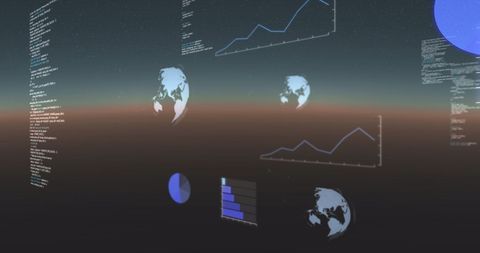
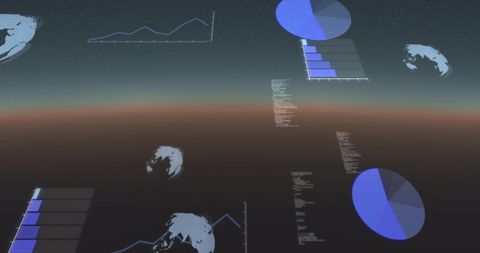
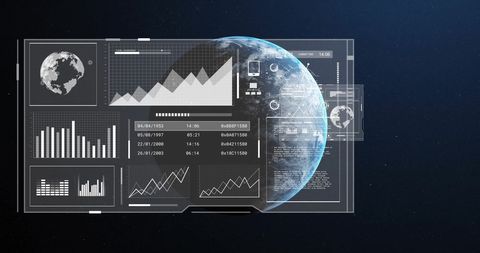
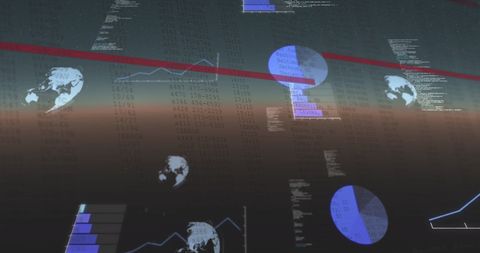
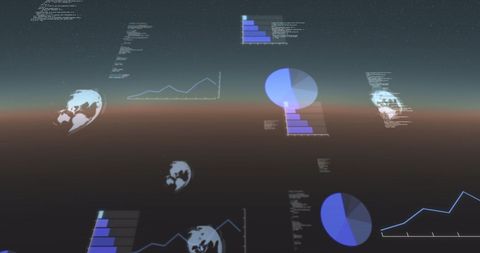
- Digital Interface with Data Charts Graphs on Gradient Background
Digital Interface with Data Charts Graphs on Gradient Background Image

Digital charts and graphs float on a gradient background suggesting futuristic data processing and global networking. Ideal for use in presentations involving technology, global communication, networking strategies, or data analysis themes. Useful in tech-related blog enhancements or educational materials focusing on statistics and technological advances.
Powered by 


downloads
Tags:
More
Credit Photo
If you would like to credit the Photo, here are some ways you can do so
Text Link
photo Link
<span class="text-link">
<span>
<a target="_blank" href=https://pikwizard.com/photo/digital-interface-with-data-charts-graphs-on-gradient-background/dafc4b0cf42213f1d3d2475e1e9673c1/>PikWizard</a>
</span>
</span>
<span class="image-link">
<span
style="margin: 0 0 20px 0; display: inline-block; vertical-align: middle; width: 100%;"
>
<a
target="_blank"
href="https://pikwizard.com/photo/digital-interface-with-data-charts-graphs-on-gradient-background/dafc4b0cf42213f1d3d2475e1e9673c1/"
style="text-decoration: none; font-size: 10px; margin: 0;"
>
<img src="https://pikwizard.com/pw/medium/dafc4b0cf42213f1d3d2475e1e9673c1.jpg" style="margin: 0; width: 100%;" alt="" />
<p style="font-size: 12px; margin: 0;">PikWizard</p>
</a>
</span>
</span>
Free (free of charge)
Free for personal and commercial use.
Author: Awesome Content
Similar Free Stock Images
Premium


Premium
Premium


Premium


Premium

Premium

Premium


Premium


Premium


Premium


Premium


Premium


Premium


Premium

Premium

Premium


Premium


Premium


Premium


Premium


Premium

Premium

Premium


Premium


Premium


Explore More Free Stock Images