
- Home >
- Stock Photos >
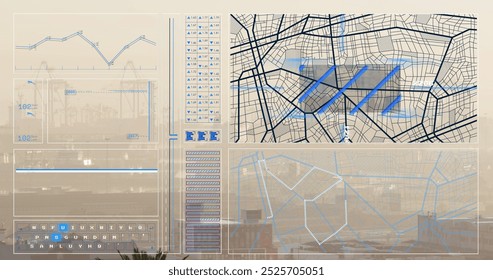
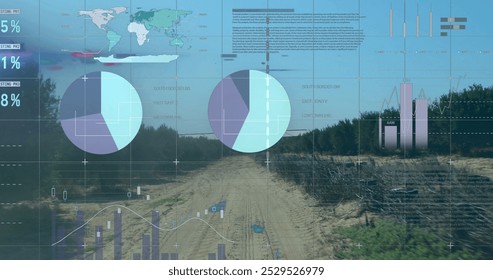
- Digital Interface with Data Diagrams and Processing Metrics
Digital Interface with Data Diagrams and Processing Metrics Image

Visual depicting a futuristic digital interface, presenting various data diagrams and processing metrics against a black background. This technology-oriented graphic includes line charts, graphs, and digital coding, symbolizing complex analytics and global business processes. Suitable for use in materials addressing technology growth, futuristic UI design, digital transformation, and business analytics. Ideal for illustrating themes in software engineering, cyber intelligence, and tech development.
Powered by  - Get 15% off with code: PIKWIZARD15


downloads
Tags:
More
Credit Photo
If you would like to credit the Photo, here are some ways you can do so
Text Link
photo Link
<span class="text-link">
<span>
<a target="_blank" href=https://pikwizard.com/photo/digital-interface-with-data-diagrams-and-processing-metrics/0eb1f569b003289d15815d51ce7ea3e2/>PikWizard</a>
</span>
</span>
<span class="image-link">
<span
style="margin: 0 0 20px 0; display: inline-block; vertical-align: middle; width: 100%;"
>
<a
target="_blank"
href="https://pikwizard.com/photo/digital-interface-with-data-diagrams-and-processing-metrics/0eb1f569b003289d15815d51ce7ea3e2/"
style="text-decoration: none; font-size: 10px; margin: 0;"
>
<img src="https://pikwizard.com/pw/medium/0eb1f569b003289d15815d51ce7ea3e2.jpg" style="margin: 0; width: 100%;" alt="" />
<p style="font-size: 12px; margin: 0;">PikWizard</p>
</a>
</span>
</span>
Free (free of charge)
Free for personal and commercial use.
Author: Awesome Content
Similar Free Stock Images

Premium


Premium

Premium


Premium


Premium


Premium


Premium


Premium

Premium

Premium

Premium


Premium


Premium


Premium


Premium


Premium


Premium


Premium


Premium


Premium


Premium

Premium


Premium


Premium


Premium


Explore More Free Stock Images