
- Home >
- Stock Photos >
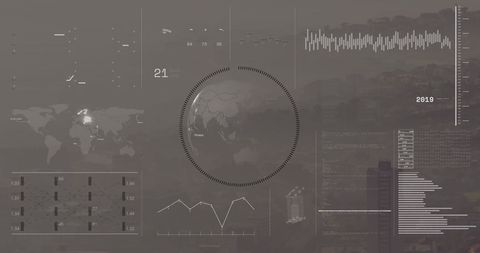
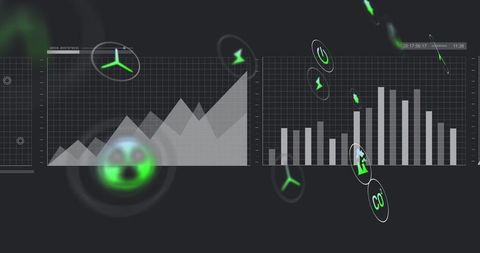
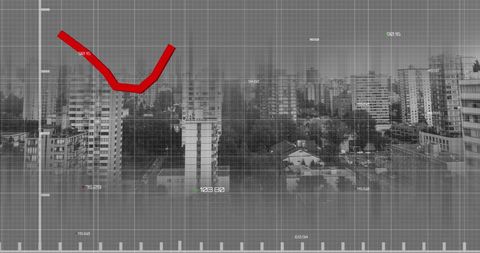
- Digital Interface with Data Graph and Circular Scanner
Digital Interface with Data Graph and Circular Scanner Image
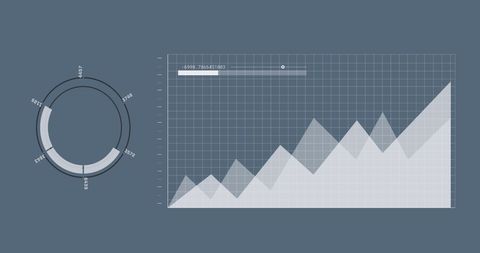
Illustrating futuristic data interaction through circular scanner and graph, invaluable for presentations on business technology, data science, or global communication networks. Graphic design emphasizes modern digital themes, appealing to trendy tech backgrounds and analytical dashboards.
Powered by 


downloads
Tags:
More
Credit Photo
If you would like to credit the Photo, here are some ways you can do so
Text Link
photo Link
<span class="text-link">
<span>
<a target="_blank" href=https://pikwizard.com/photo/digital-interface-with-data-graph-and-circular-scanner/651a5c2a4fde56c61c7d61df019be279/>PikWizard</a>
</span>
</span>
<span class="image-link">
<span
style="margin: 0 0 20px 0; display: inline-block; vertical-align: middle; width: 100%;"
>
<a
target="_blank"
href="https://pikwizard.com/photo/digital-interface-with-data-graph-and-circular-scanner/651a5c2a4fde56c61c7d61df019be279/"
style="text-decoration: none; font-size: 10px; margin: 0;"
>
<img src="https://pikwizard.com/pw/medium/651a5c2a4fde56c61c7d61df019be279.jpg" style="margin: 0; width: 100%;" alt="" />
<p style="font-size: 12px; margin: 0;">PikWizard</p>
</a>
</span>
</span>
Free (free of charge)
Free for personal and commercial use.
Author: Authentic Images
Similar Free Stock Images

Premium


Premium

Premium


Premium


Premium


Premium


Premium


Premium


Premium


Premium


Premium


Premium


Premium


Premium

Premium

Premium


Premium


Premium


Premium


Premium


Premium

Premium


Premium


Premium


Premium


Explore More Free Stock Images