
- Home >
- Stock Photos >
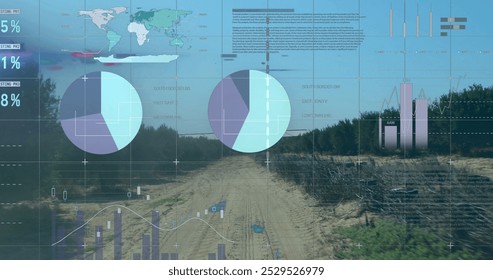
- Digital Interface with Data Graphs and Charts on Blue Background
Digital Interface with Data Graphs and Charts on Blue Background Image

Visually striking depiction of various data charts and graphs over a blue background, ideal for use in presentations, reports, and marketing materials related to finance, stock markets, and data analysis. This digital representation of statistical information enhances the sense of modern technology and futuristic data processing.
Powered by  - Get 15% off with code: PIKWIZARD15


downloads
Tags:
More
Credit Photo
If you would like to credit the Photo, here are some ways you can do so
Text Link
photo Link
<span class="text-link">
<span>
<a target="_blank" href=https://pikwizard.com/photo/digital-interface-with-data-graphs-and-charts-on-blue-background/1e201e9af02f555c7ec415e460007153/>PikWizard</a>
</span>
</span>
<span class="image-link">
<span
style="margin: 0 0 20px 0; display: inline-block; vertical-align: middle; width: 100%;"
>
<a
target="_blank"
href="https://pikwizard.com/photo/digital-interface-with-data-graphs-and-charts-on-blue-background/1e201e9af02f555c7ec415e460007153/"
style="text-decoration: none; font-size: 10px; margin: 0;"
>
<img src="https://pikwizard.com/pw/medium/1e201e9af02f555c7ec415e460007153.jpg" style="margin: 0; width: 100%;" alt="" />
<p style="font-size: 12px; margin: 0;">PikWizard</p>
</a>
</span>
</span>
Free (free of charge)
Free for personal and commercial use.
Author: Awesome Content
Similar Free Stock Images

Premium


Premium

Premium


Premium


Premium


Premium


Premium


Premium

Premium

Premium

Premium


Premium


Premium


Premium


Premium


Premium


Premium


Premium


Premium


Premium


Premium

Premium


Premium


Premium


Premium


Explore More Free Stock Images