
- Home >
- Stock Photos >
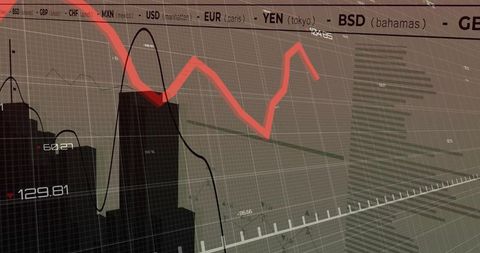
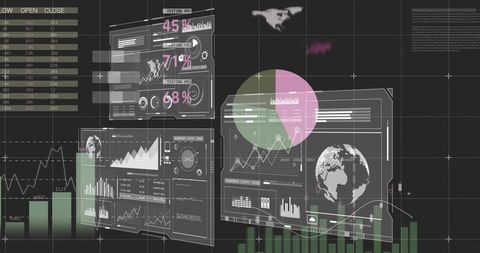
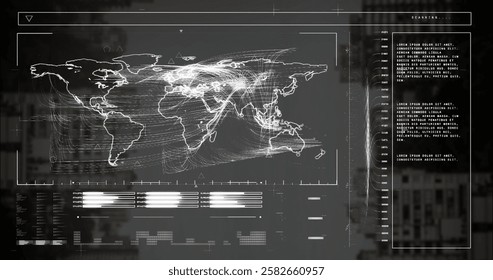
- Digital Interface with Data Graphs and Charts
Digital Interface with Data Graphs and Charts Image

Futuristic scene featuring various line graphs and data charts over grey background conveys a sense of global connectivity and advanced analytical capabilities. Useful for illustrating concept of data-driven decision making, technological advancement, online networking, or financial analysis. Can enhance presentations or materials in business and tech industries.
Powered by  - Get 15% off with code: PIKWIZARD15


downloads
Tags:
More
Credit Photo
If you would like to credit the Photo, here are some ways you can do so
Text Link
photo Link
<span class="text-link">
<span>
<a target="_blank" href=https://pikwizard.com/photo/digital-interface-with-data-graphs-and-charts/1ce3aeb938705a8e5986d21cdb026576/>PikWizard</a>
</span>
</span>
<span class="image-link">
<span
style="margin: 0 0 20px 0; display: inline-block; vertical-align: middle; width: 100%;"
>
<a
target="_blank"
href="https://pikwizard.com/photo/digital-interface-with-data-graphs-and-charts/1ce3aeb938705a8e5986d21cdb026576/"
style="text-decoration: none; font-size: 10px; margin: 0;"
>
<img src="https://pikwizard.com/pw/medium/1ce3aeb938705a8e5986d21cdb026576.jpg" style="margin: 0; width: 100%;" alt="" />
<p style="font-size: 12px; margin: 0;">PikWizard</p>
</a>
</span>
</span>
Free (free of charge)
Free for personal and commercial use.
Author: People Creations
Similar Free Stock Images

Premium


Premium


Premium


Premium


Premium


Premium


Premium


Premium

Premium

Premium


Premium


Premium


Premium


Premium

Premium


Premium

Premium


Premium


Premium


Premium


Premium


Premium


Premium


Premium


Premium

Explore More Free Stock Images