
- Home >
- Free Stock Photos & Images >
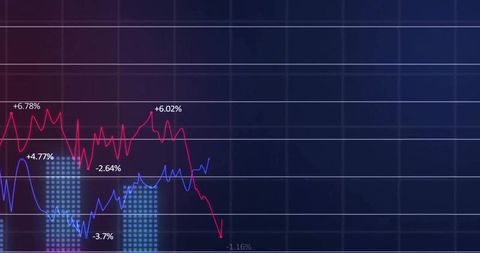
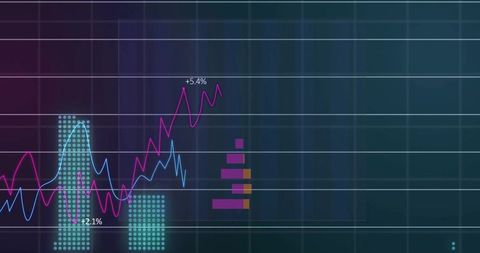
- Digital Interface with Data Graphs and JavaScript Code
Digital Interface with Data Graphs and JavaScript Code Free Stock Image

This digital space features complex graphs and dynamic programming code, symbolizing the integration of technology and finance. The use of visuals in global business presentations or technology demonstrations can emphasize the impact of data analytics. Ideal for illustrating advanced financial technology concepts or economic data interpretation.
Powered by  - Get 15% off with code: PIKWIZARD15


downloads
Tags:
More
Credit Photo
If you would like to credit the Photo, here are some ways you can do so
Text Link
photo Link
<span class="text-link">
<span>
<a target="_blank" href=https://pikwizard.com/photo/digital-interface-with-data-graphs-and-javascript-code/0b32b1edc8df3820d3318cb8eebe3594/>PikWizard</a>
</span>
</span>
<span class="image-link">
<span
style="margin: 0 0 20px 0; display: inline-block; vertical-align: middle; width: 100%;"
>
<a
target="_blank"
href="https://pikwizard.com/photo/digital-interface-with-data-graphs-and-javascript-code/0b32b1edc8df3820d3318cb8eebe3594/"
style="text-decoration: none; font-size: 10px; margin: 0;"
>
<img src="https://thumbs.wbm.im/pw/medium/0b32b1edc8df3820d3318cb8eebe3594.jpg" style="margin: 0; width: 100%;" alt="Digital Interface with Data Graphs and JavaScript Code" />
<p style="font-size: 12px; margin: 0;">PikWizard</p>
</a>
</span>
</span>
Free (free of charge)
Free for personal and commercial use.
Author: Awesome Content
Similar Free Stock Images


Premium


Premium


Premium


Premium


Premium


Premium


Premium


Premium


Premium


Premium


Premium


Premium


Premium


Premium


Premium


Premium


Premium


Premium


Premium


Premium


Premium


Premium


Premium


Premium


Premium

Explore More Free Stock Images