- Home >
- Stock Photos >
- Digital Interface with Data Processing and Business Analytics
Digital Interface with Data Processing and Business Analytics Image
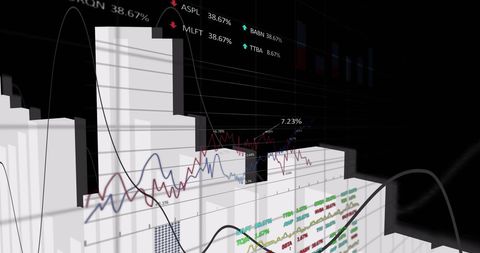
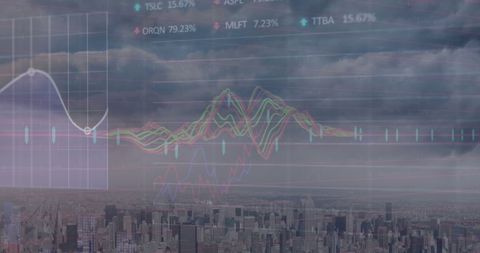
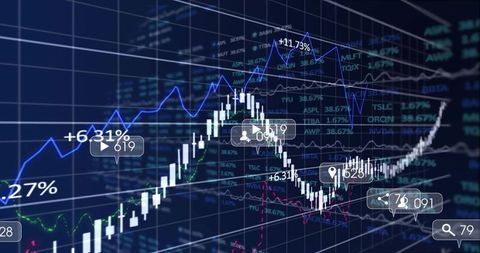
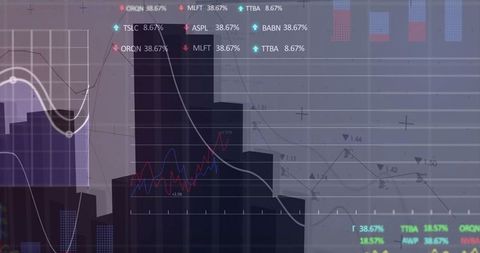
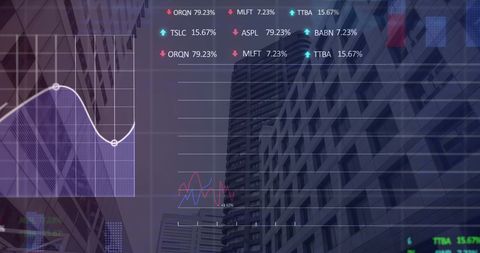
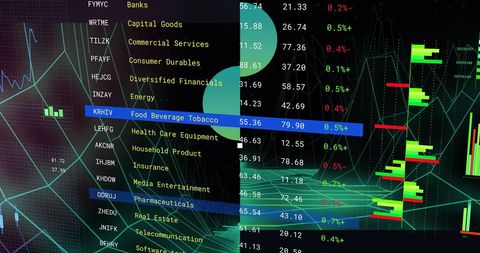
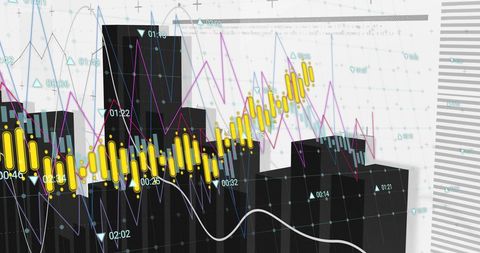
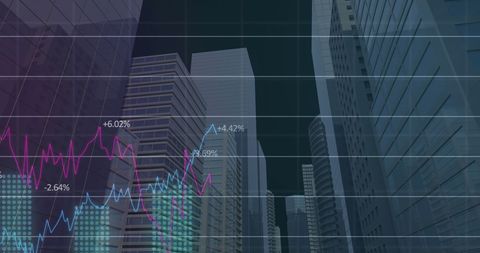
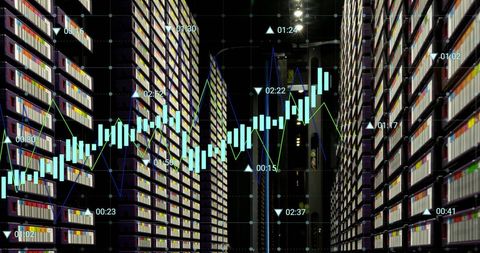
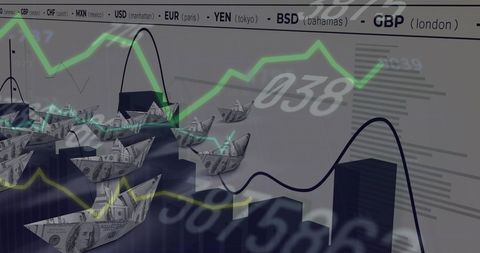
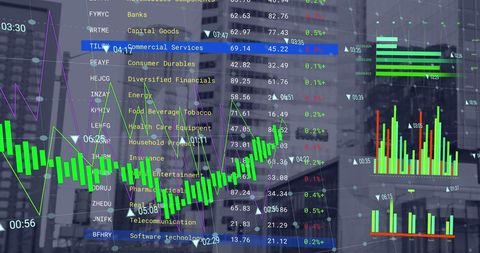
Visual representation of data processing over business discussions. Financial charts and digital analytics illustrate market trends and economic growth. Ideal for material discussing financial markets, digital entrepreneurship, and global business strategies. Use in stock market presentations and analytic software demonstrations.

downloads
Tags:
More
Credit Photo
If you would like to credit the Photo, here are some ways you can do so
Text Link
photo Link
<span class="text-link">
<span>
<a target="_blank" href=https://pikwizard.com/photo/digital-interface-with-data-processing-and-business-analytics/db3ad73c258d70ca39c3ec6fe3cd163d/>PikWizard</a>
</span>
</span>
<span class="image-link">
<span
style="margin: 0 0 20px 0; display: inline-block; vertical-align: middle; width: 100%;"
>
<a
target="_blank"
href="https://pikwizard.com/photo/digital-interface-with-data-processing-and-business-analytics/db3ad73c258d70ca39c3ec6fe3cd163d/"
style="text-decoration: none; font-size: 10px; margin: 0;"
>
<img src="https://pikwizard.com/pw/medium/db3ad73c258d70ca39c3ec6fe3cd163d.jpg" style="margin: 0; width: 100%;" alt="" />
<p style="font-size: 12px; margin: 0;">PikWizard</p>
</a>
</span>
</span>
Free (free of charge)
Free for personal and commercial use.
Author: Awesome Content