
- Home >
- Stock Photos >
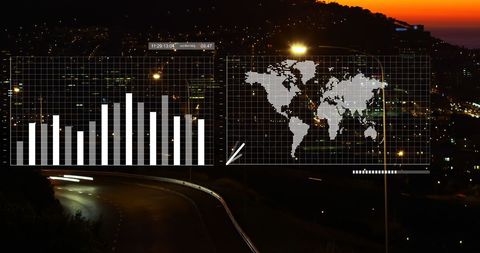
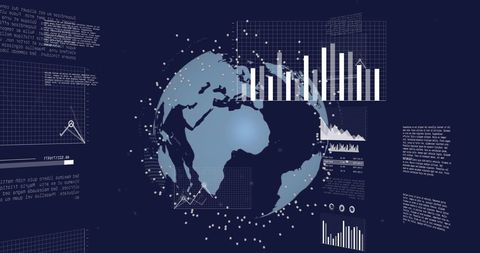
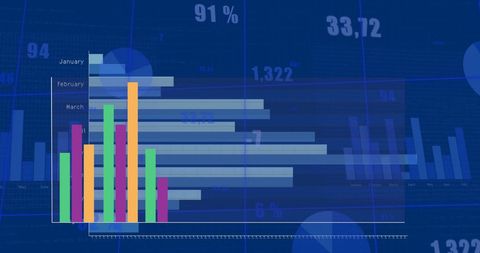
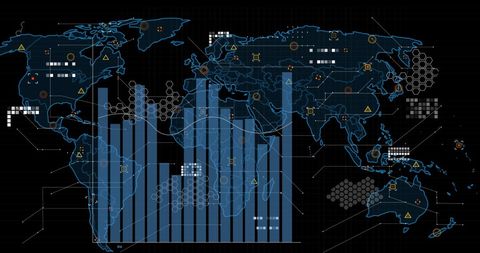
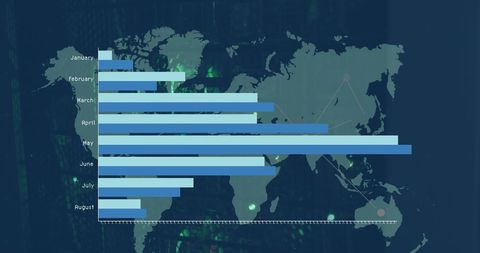
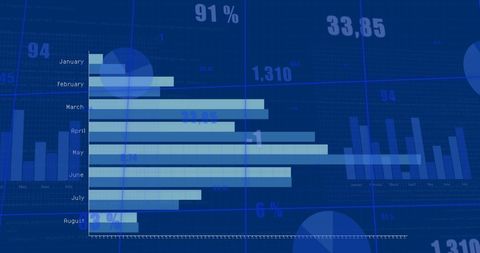
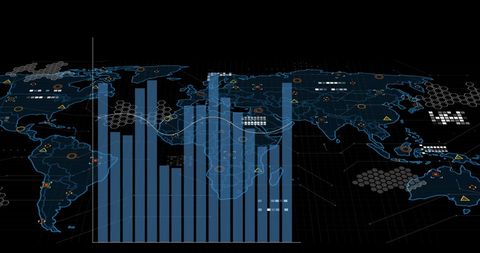
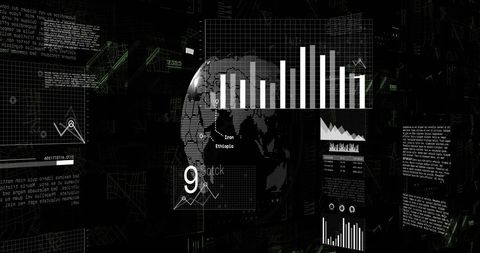
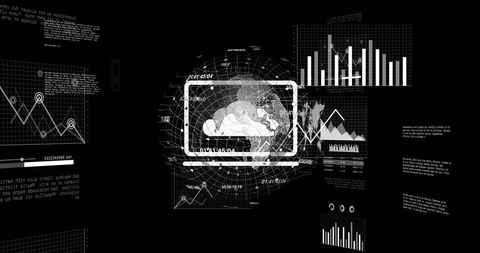
- Digital Interface with Data Visualizations on Technology Background
Digital Interface with Data Visualizations on Technology Background Image

Depicts digital screen showcasing bar chart and world map, representing access to real-time analytics and global data overlay. Ideal for presentations on technology, data analysis, or business strategy. Visual resource for illustrating digital transformation in businesses.
Powered by 


downloads
Tags:
More
Credit Photo
If you would like to credit the Photo, here are some ways you can do so
Text Link
photo Link
<span class="text-link">
<span>
<a target="_blank" href=https://pikwizard.com/photo/digital-interface-with-data-visualizations-on-technology-background/a50639ca504fab6c642b130578420005/>PikWizard</a>
</span>
</span>
<span class="image-link">
<span
style="margin: 0 0 20px 0; display: inline-block; vertical-align: middle; width: 100%;"
>
<a
target="_blank"
href="https://pikwizard.com/photo/digital-interface-with-data-visualizations-on-technology-background/a50639ca504fab6c642b130578420005/"
style="text-decoration: none; font-size: 10px; margin: 0;"
>
<img src="https://pikwizard.com/pw/medium/a50639ca504fab6c642b130578420005.jpg" style="margin: 0; width: 100%;" alt="" />
<p style="font-size: 12px; margin: 0;">PikWizard</p>
</a>
</span>
</span>
Free (free of charge)
Free for personal and commercial use.
Author: Creative Art
Similar Free Stock Images

Premium


Premium


Premium

Premium


Premium


Premium


Premium

Premium

Premium

Premium


Premium

Premium


Premium


Premium


Premium

Premium

Premium


Premium


Premium


Premium


Premium


Premium


Premium


Premium


Premium


Explore More Free Stock Images