
- Home >
- Stock Photos >
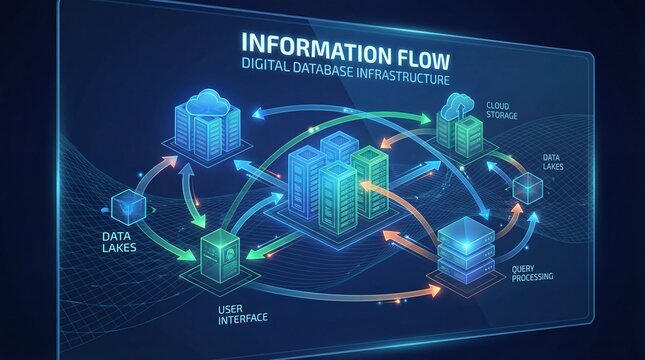
- Digital Interface with Data Visuals for Technology Concepts
Digital Interface with Data Visuals for Technology Concepts Image

Visual illustrating digital data processing with bar and pie charts on a digital interface, ideal for conveying advanced technology or data analytics concepts. Useful for presentations, articles, or marketing materials focusing on digital innovation or information technology.
Powered by 


downloads
Tags:
More
Credit Photo
If you would like to credit the Photo, here are some ways you can do so
Text Link
photo Link
<span class="text-link">
<span>
<a target="_blank" href=https://pikwizard.com/photo/digital-interface-with-data-visuals-for-technology-concepts/c8319628612fe366616438f6d3581d63/>PikWizard</a>
</span>
</span>
<span class="image-link">
<span
style="margin: 0 0 20px 0; display: inline-block; vertical-align: middle; width: 100%;"
>
<a
target="_blank"
href="https://pikwizard.com/photo/digital-interface-with-data-visuals-for-technology-concepts/c8319628612fe366616438f6d3581d63/"
style="text-decoration: none; font-size: 10px; margin: 0;"
>
<img src="https://pikwizard.com/pw/medium/c8319628612fe366616438f6d3581d63.jpg" style="margin: 0; width: 100%;" alt="" />
<p style="font-size: 12px; margin: 0;">PikWizard</p>
</a>
</span>
</span>
Free (free of charge)
Free for personal and commercial use.
Author: Authentic Images
Similar Free Stock Images

Premium


Premium

Premium


Premium


Premium


Premium


Premium


Premium


Premium

Premium

Premium


Premium


Premium


Premium


Premium


Premium


Premium


Premium

Premium


Premium


Premium


Premium


Premium

Premium


Premium


Explore More Free Stock Images