1. Home > 
  2. Stock Photos > 
  3. Digital Interface with Declining Graph Overlay in Office Environment

Digital Interface with Declining Graph Overlay in Office Environment Image

Digital Interface with Declining Graph Overlay in Office Environment

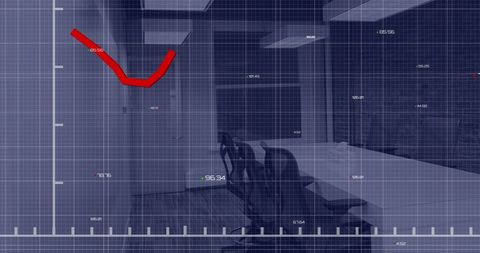
This composition features a digitally generated declining red graph overlaid on a technical grid, set against a shadowed image of a computer and desk furniture, conveying themes of data analytics and business strategies. Suitable for illustrating concepts related to business trends, data analysis challenges, stock market fluctuations, or digital communication advancements.

Powered by Adobe logo
Businessman interacting with digital forex and stock market chart interface showing buy and sell decisions with futuristic holographic data overlay. - Powered by AdobeAbstract financial data visualization - Powered by AdobeBlurry cityscape with financial chart overlay - Powered by AdobeTablet displaying financial data graphs on a dark control panel - Powered by AdobeDigital Stock Market Chart with Upward & Downward Trends. Financial Data Analysis & Investment Growth Concept. - Powered by Adobe

Credit Photo

If you would like to credit the Photo, here are some ways you can do so

Free (free of charge)

Free for personal and commercial use.

Author: Awesome Content

Similar Free Stock Images

Dynamic Digital Interface Displaying Financial Data Analysis
Premium
fingers touch financial data charts
Colleagues Analyzing Data Trends in Modern Office Environment
Premium
Businessman analyzing a transparent digital dashboard showcasing a rising quality graph and a declining cost chart with percentage indicators.
Premium
Digital tablet displaying financial data charts
Red up and down financial graph on grey digital background
Dynamic Financial Growth Graph on Blue Grid Background
Downward Trending Graph with Office Background
Red Graph Line over Office Workspace Representing Market Trends
Global Financial Data Processing with Graphs and Charts on Dark Background
Digital Display of Financial Downtrend in Modern Office
Declining Financial Chart Displayed Over Urban Cityscape
Premium
Residential houses experiencing market turmoil, digital HUD interface with sharp red declining charts, global real estate recession and financial housing crisis concept
Premium
Abstract financial data visualization on a dark background.  Colorful charts and graphs overlay a reflective surface, creating a complex digital display.
Digital Interface Displaying Stock Market Data and Statistics
Stock Market Data Visualization with Office Background
Financial Data on Office Desk with Digital Charts
Financial Data Visualization with Red Downtrend Line in Virtual Environment
Financial Data Analysis with Declining Trend on Blueprint Graph
Digital Fintech Visualization with Graphs and Data Icons
Financial Data Overlay on Business Meeting Collaborative Strategy
Abstract Financial Graph with Upward Trend Line
Premium
The hand illustrating financial trends on a digital trading chart.
Descending Financial Graph on Global Grid Background
Interactive Financial Graph with Economics Concept
Stressed Female Doctor with Falling Graph in Background Illustrating Challenges
Premium
Abstract glowing digital bar graph showing fluctuating financial data.
Dynamic Red Line Showing Business Analytics Insights
Stock Market Trends and Data Analysis over Digital Grid
Green Financial Data Chart with Technological Overlay
Red Line Graph Showing Financial Decline on Grid Background
Financial Graphs Overlaying Business Collaboration in Office
Dynamic Chart and Globe Depict Global Financial Movement
Unattended Office with Financial Graph Overlay Concept
Stock Market Decline Data Analysis on Dark Grid Background
Business Decline Shown in Corporate Presentation Setting
Digital Data Processing Overlay on Urban Cityscape
Dynamic Financial Data Charts and Digital Interface Concepts
Premium
Businessman typing on laptop with warning icon and declining bar chart, indicating data analysis issue or financial risk in digital report, concept of business problem or cybersecurity alert
Premium
Close-up of a digital screen displaying financial market data and dynamic stock charts, reflecting investment trends and economic analysis in a modern business environment.
Premium
Magnifying glass focused on financial chart data on a touchscreen
Premium
3d rendered market decline chart with red arrow and grid background showing financial downturn trend
Digital Dashboard Analytics Graphic Illustrating Trends
Digital Financial Graphs Overlapping Modern Office Scene
Dynamic Financial Market Graph with Data Points
Dynamic Financial Growth Chart in Modern Office
Premium
Abstract financial candlestick chart showing market data fluctuations on a dark digital background for investment trend concept and economic analysis
Futuristic Data Graph Overlay on Urban Cityscape
Diverse Business Team Analyzing Financial Data Illustration
Financial Market Chart on Digital Screen Showing Growing Trends
Premium
person uses a smartphone while a glowing red digital stock chart with arrows and bars floats above, financial analytics, bear market downtrends,and economic fluctuations. crisis and recession.
Premium
European Union economic concept with digital forex and crypto trade graphs on a hologram background featuring financial chart data overlay.
Dynamic Stock Market Graph Fluctuating in Modern Office
Two Businesswomen Analyzing Red Graph in Modern Office Heavily Focused
Colleagues Analyzing Financial Data Visualization in Modern Office
Red Line Graph Overlay on Cityscape Represents Economic Trends
Premium
Futuristic hallway with vibrant financial data wall
Red Zigzag Trend Lines Crossing Dark Binary Grid Representing Financial Data Fluctuations
Digital Security and Economic Networking Data Concept
Digital Data Display in Modern Office on Virtual Grid
Green Line Graph Overlaying Modern Office Setting
Digital Data Analysis Concept with Graph on Grid Background
Financial Data Graph with Rising Green Line and Analytics Dashboard
Rising Data Graph with Changing Numbers on Blue Grid
Global Market Trends Featuring Multi-Series Line Charts Over Dotted World Map and Grid
Premium
A person interacting with a tablet displaying various data visualizations, showcasing charts and graphs for analysis.
Digital Data Analytics Overlay on Urban Skyline
Red Line Graph Overlaying Office Computers Symbolizing Data Analysis
Financial Chart Overlay on Modern Office Background
Global Business Colleagues Discussing Trend Data Analytics in Office
Green Line Graph Overlaid on Empty Office with Data Overlay
Colleagues Analyzing Financial Data Overlay in Modern Office
Fluctuating Stock Chart Overlay in Modern Office Environment
Futuristic HUD Interface for Data Analysis and Finance
Ukraine Crisis Economic Downturn Illustrated by Financial Graph
Falling Spike Pattern in Digital Heart Icon Graph
Digitally Generated Green Line Graph in Modern Office Setup
Financial Data Growth Over Urban Cityscape with Graph Overlay
Digital Data Graph Overlays on Urban Cityscape
Premium
Abstract financial data visualization
Financial Data Analytics on Digital Interface
Beveled Green Trend Line Moving Across Dark Blue Grid Showing Market Data Visualization
Business Analytics with Declining Graph Overlay App Display Concept
Business Data Analysis with Red Declining Graph on Office Desk Background
Premium
Abstract financial data
Digital Data Visualization with Dynamic Graph and Global Interface
Digital Financial Data Display with Analytical Charts
Financial Analytics Chart in Digital Interface Design
Dynamic Green Business Data Graph with Office Backdrop
Red Decline Line with Data Overlapping Server Room Background
Premium
Businessman Analyzing Cost Reduction on Digital Interface
Diverse Businesswomen Analyzing Financial Growth with Digital Graph Overlay
Futuristic HUD cockpit displaying holographic telemetry, navigation and green performance graph
Business Graph on Office Computer Desks Background
Digital Interface with Graphs and Data Overlaid on Building
Graph Visualizing Economic Downtrend and Financial Data
Waveform Graph with Red Line Over Grid and Eyeglasses Symbolizing Analytics
Green Financial Data Line Graph Over Cityscape Background
Digital Financial Data Analysis Overlay in Modern Office
Cityscape with Digital Financial Data Overlay Inspiration for Global Business
Green Line Graph Showing Growth with Office Desk Background
Financial Data Overlay on Office Computers
Rising Green Line on Financial Digital Display
Dynamics of Financial Growth in Modern Business Setting
Global Financial Data Trends on World Map
Premium
Hand interacting with a red, declining graph, highlighting risks
Economic Crisis Graph Over Ukraine Flag Illustrating Financial Downturn
Red Graph Line Overlaying Cityscape Represents Market Trends
Businesswoman Analyzing Fluctuating Market Statistics
Financial Chart with Falling Trends in Corporate Environment
Financial Statistics Overlay Office Cadence
Premium
Pause trading button pressed by hand near laptop with stock market loss chart showing ai investment risk
Executive Analyzing Data on Tablet with Red Line Graph Overlay
Futuristic Digital Financial Analysis with City Background
Analyzing Fluctuating Data Graph with Technology in Office Setting
Dynamic Red Line Graph on Dark Background Depicting Financial Crisis
Dynamic Red Line Graph on Digital Black Grid Background
Premium
Stock market graph analysis urban business district digital data visualization modern architecture aerial perspective
Financial Market Analysis Overlaying Urban Cityscape
Server Room Data Analytics with Declining Graph Representation
Red Trend Line with Data Processing in Modern Office
Digital Data Analysis with Network Connections on a Grid Background
Premium
Analyzing financial data on a computer screen with a stylus
Premium
Financial market crash concept with declining stock chart, digital world map and credit card chip on dark background with orange highlights.
Premium
Hand manipulating a downward trend graph
Explore More Free Stock Images