- Home >
- Stock Photos >
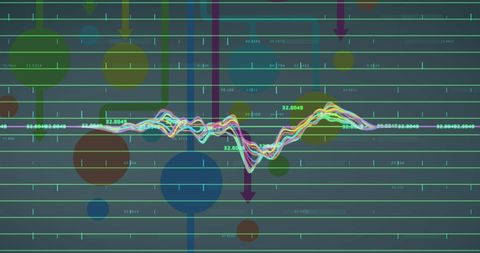
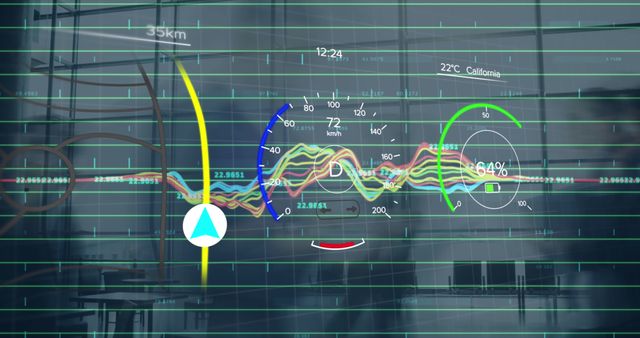
- Digital Interface with Dynamic Statistics and Data Processing Graphics
Digital Interface with Dynamic Statistics and Data Processing Graphics Image

Digital interface displaying vibrant statistics and data processing elements in an organized and modern arrangement, ideal for stressing innovative business and technology themes. Can be used in presentations depicting the impact of data on global business trends, visual materials for technology companies, or project demonstrations involving data analytics and technical systems development.

downloads
Tags:
More
Credit Photo
If you would like to credit the Photo, here are some ways you can do so
Text Link
photo Link
<span class="text-link">
<span>
<a target="_blank" href=https://pikwizard.com/photo/digital-interface-with-dynamic-statistics-and-data-processing-graphics/40611cfd611cf685942df97f5807a982/>PikWizard</a>
</span>
</span>
<span class="image-link">
<span
style="margin: 0 0 20px 0; display: inline-block; vertical-align: middle; width: 100%;"
>
<a
target="_blank"
href="https://pikwizard.com/photo/digital-interface-with-dynamic-statistics-and-data-processing-graphics/40611cfd611cf685942df97f5807a982/"
style="text-decoration: none; font-size: 10px; margin: 0;"
>
<img src="https://pikwizard.com/pw/medium/40611cfd611cf685942df97f5807a982.jpg" style="margin: 0; width: 100%;" alt="" />
<p style="font-size: 12px; margin: 0;">PikWizard</p>
</a>
</span>
</span>
Free (free of charge)
Free for personal and commercial use.
Author: Awesome Content