
- Home >
- Stock Photos >
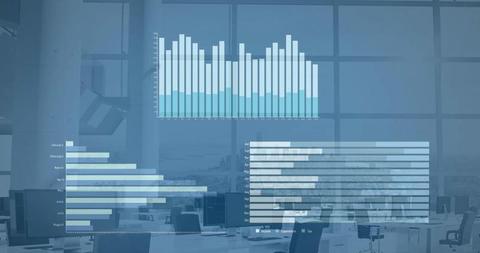
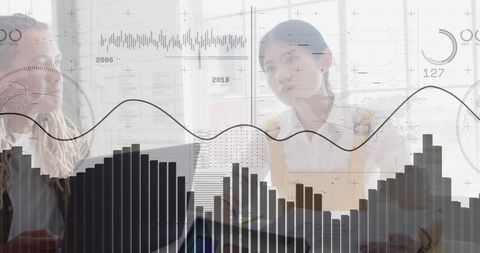
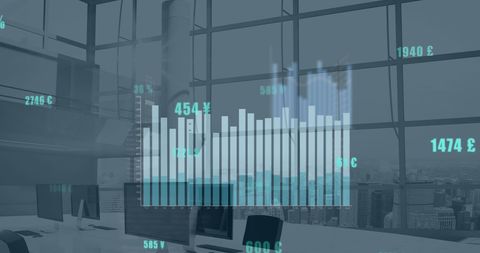
- Digital Interface with Economic Graphs Over Desk
Digital Interface with Economic Graphs Over Desk Image
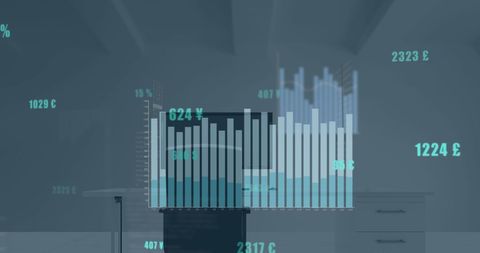
Digital interface overlaying an office desk, highlighting economic graphs and financial analysis symbols. Useful for illustrating concepts related to business technology and work environments. Great for presentations on finance, data analytics, and office organization.
Powered by 


downloads
Tags:
More
Credit Photo
If you would like to credit the Photo, here are some ways you can do so
Text Link
photo Link
<span class="text-link">
<span>
<a target="_blank" href=https://pikwizard.com/photo/digital-interface-with-economic-graphs-over-desk/a98df4a3370ed418c26be78515bbf372/>PikWizard</a>
</span>
</span>
<span class="image-link">
<span
style="margin: 0 0 20px 0; display: inline-block; vertical-align: middle; width: 100%;"
>
<a
target="_blank"
href="https://pikwizard.com/photo/digital-interface-with-economic-graphs-over-desk/a98df4a3370ed418c26be78515bbf372/"
style="text-decoration: none; font-size: 10px; margin: 0;"
>
<img src="https://pikwizard.com/pw/medium/a98df4a3370ed418c26be78515bbf372.jpg" style="margin: 0; width: 100%;" alt="" />
<p style="font-size: 12px; margin: 0;">PikWizard</p>
</a>
</span>
</span>
Free (free of charge)
Free for personal and commercial use.
Author: People Creations
Similar Free Stock Images

Premium


Premium

Premium


Premium


Premium


Premium


Premium

Premium


Premium


Premium


AI


Premium

Premium


Premium


Premium


Premium

Premium


Premium


Premium


Premium


Premium

Premium


Premium


Premium


Premium


Premium

Explore More Free Stock Images