
- Home >
- Stock Photos >
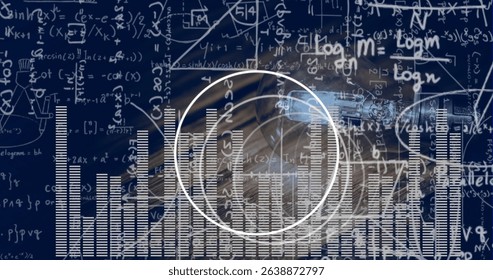
- Digital Interface with Equations and Graphs for Data Analysis
Digital Interface with Equations and Graphs for Data Analysis Image

Interface featuring complex equations and statistical graphs suggesting focus on data analysis innovation. Can illustrate concepts of advanced analytics, artificial intelligence applications, or digital transformation in technology-driven environments. Suitable for presentations on business intelligence, academic research, or emerging technology solutions.
Powered by  - Get 15% off with code: PIKWIZARD15


downloads
Tags:
More
Credit Photo
If you would like to credit the Photo, here are some ways you can do so
Text Link
photo Link
<span class="text-link">
<span>
<a target="_blank" href=https://pikwizard.com/photo/digital-interface-with-equations-and-graphs-for-data-analysis/cd04d207c2f5968fb671594b48456d4d/>PikWizard</a>
</span>
</span>
<span class="image-link">
<span
style="margin: 0 0 20px 0; display: inline-block; vertical-align: middle; width: 100%;"
>
<a
target="_blank"
href="https://pikwizard.com/photo/digital-interface-with-equations-and-graphs-for-data-analysis/cd04d207c2f5968fb671594b48456d4d/"
style="text-decoration: none; font-size: 10px; margin: 0;"
>
<img src="https://pikwizard.com/pw/medium/cd04d207c2f5968fb671594b48456d4d.jpg" style="margin: 0; width: 100%;" alt="" />
<p style="font-size: 12px; margin: 0;">PikWizard</p>
</a>
</span>
</span>
Free (free of charge)
Free for personal and commercial use.
Author: Authentic Images
Similar Free Stock Images

Premium


Premium

Premium


Premium


Premium


Premium


Premium
Premium

Premium
Premium


Premium


Premium


Premium


Premium


Premium


Premium


Premium


Premium


Premium


Premium

Premium


Premium


Premium


Premium


Premium

Explore More Free Stock Images