- Home >
- Stock Photos >
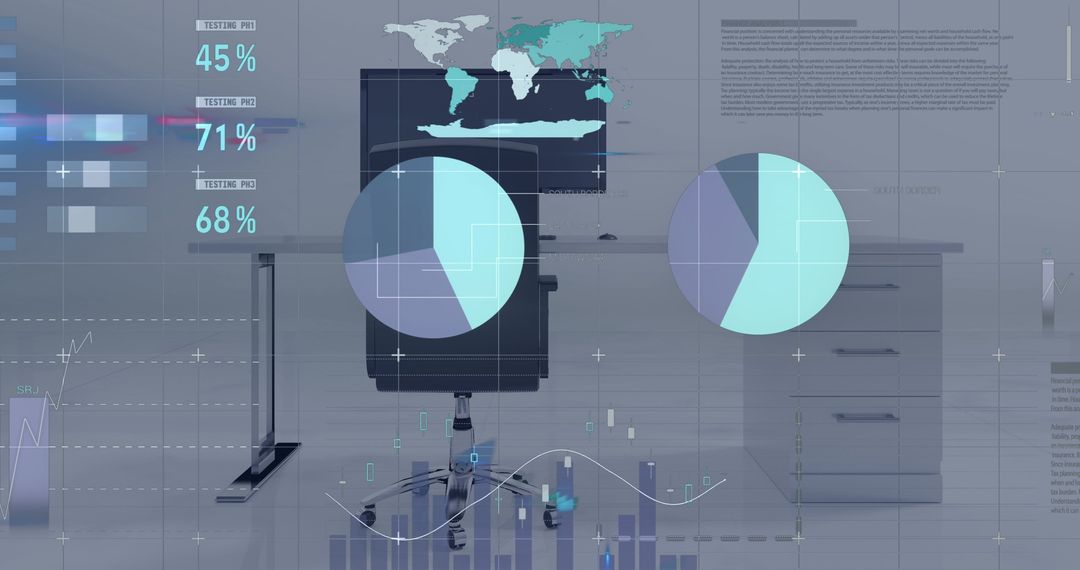
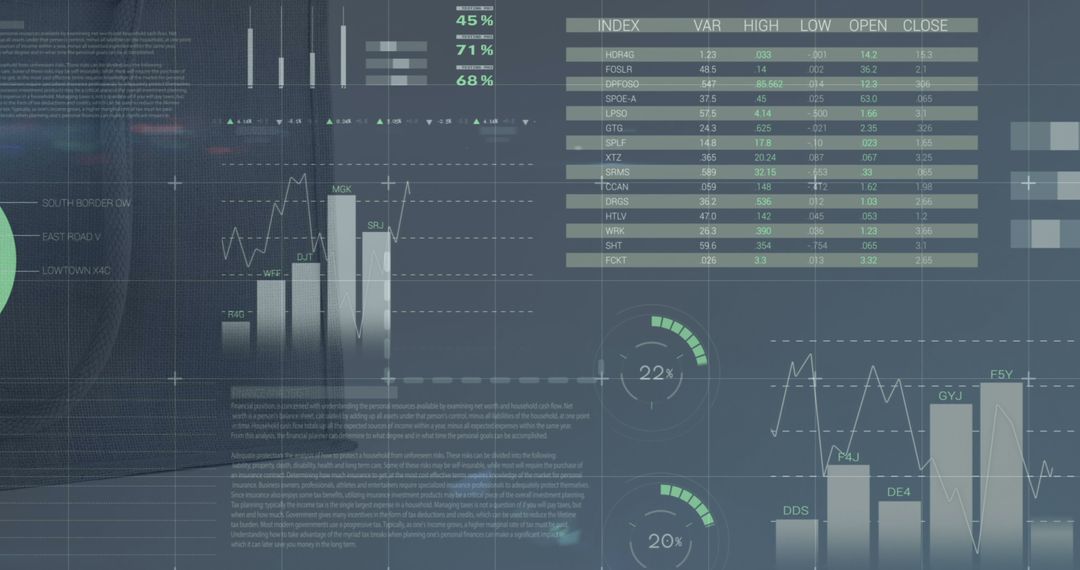
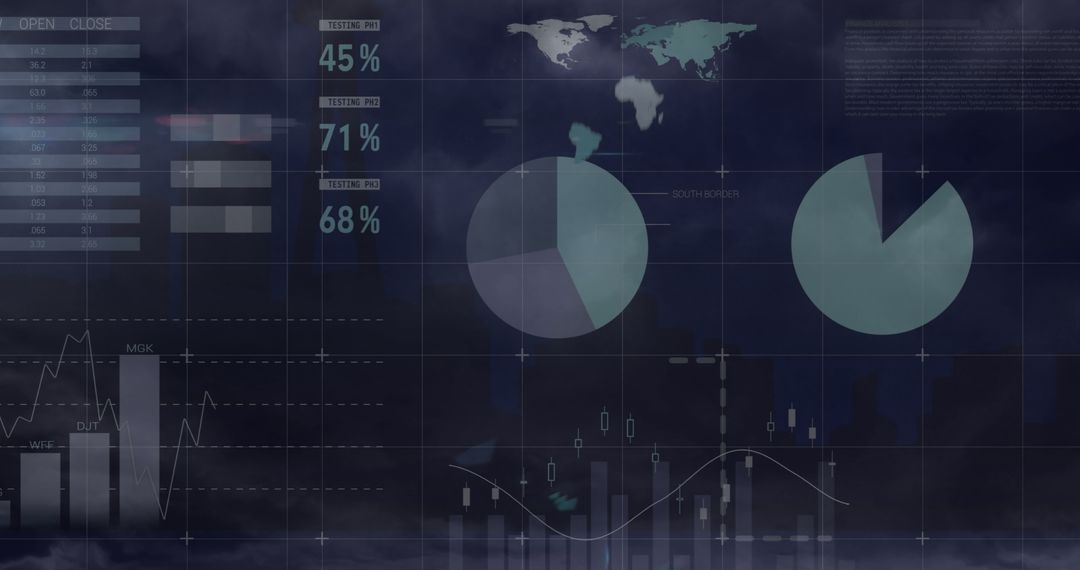
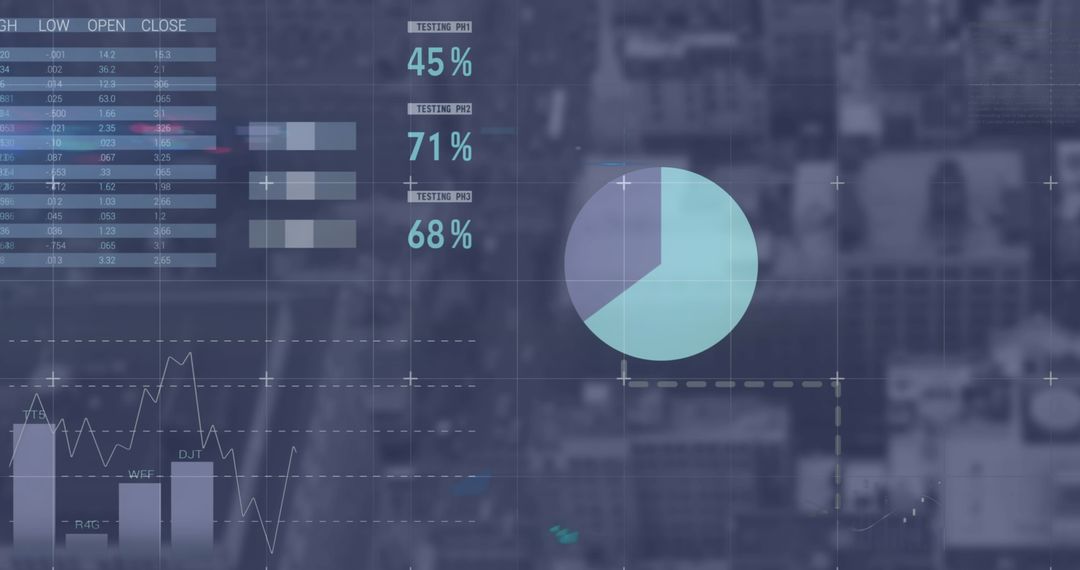
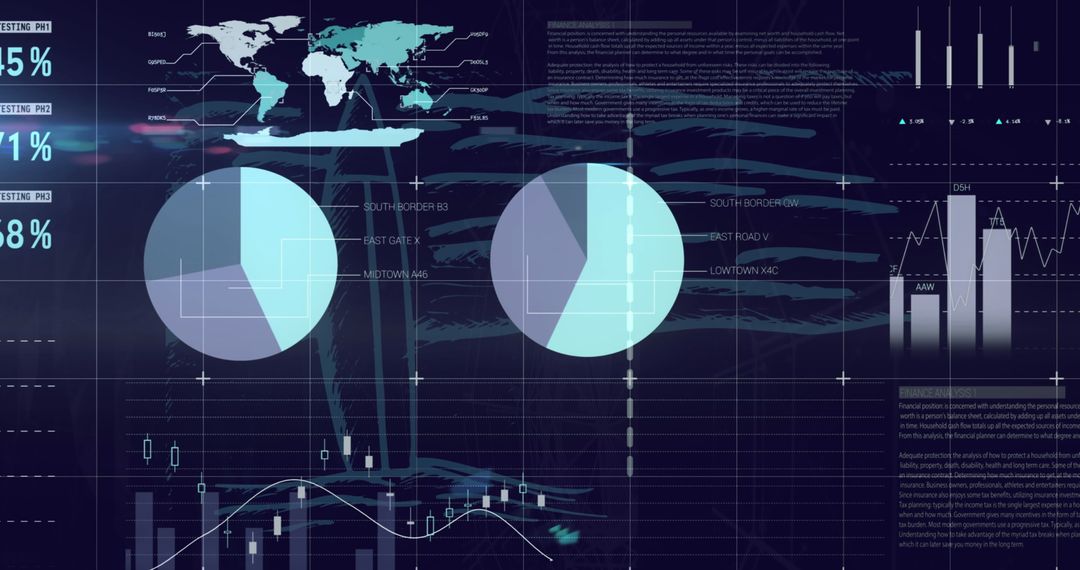
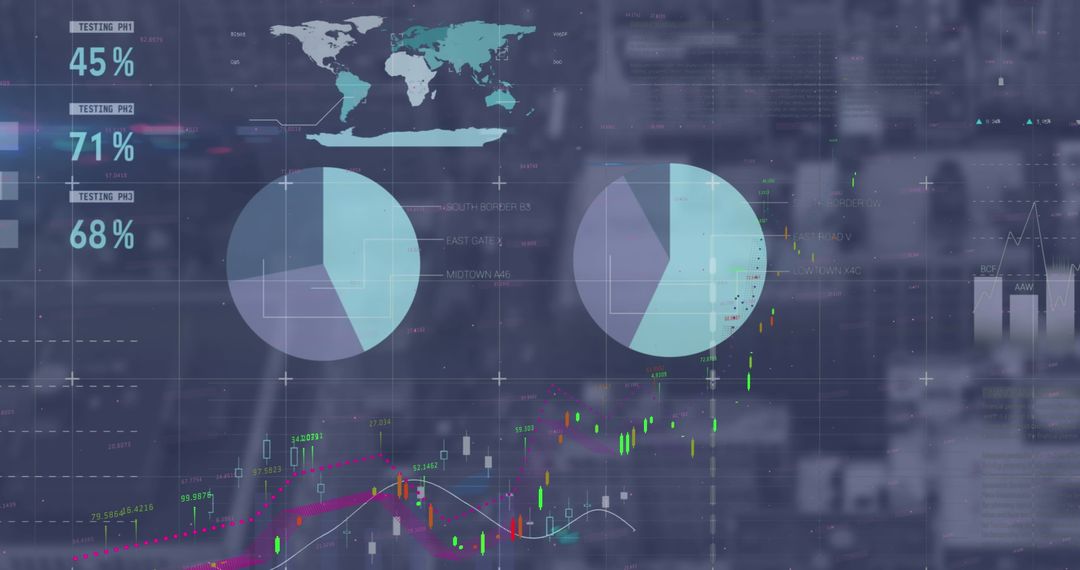
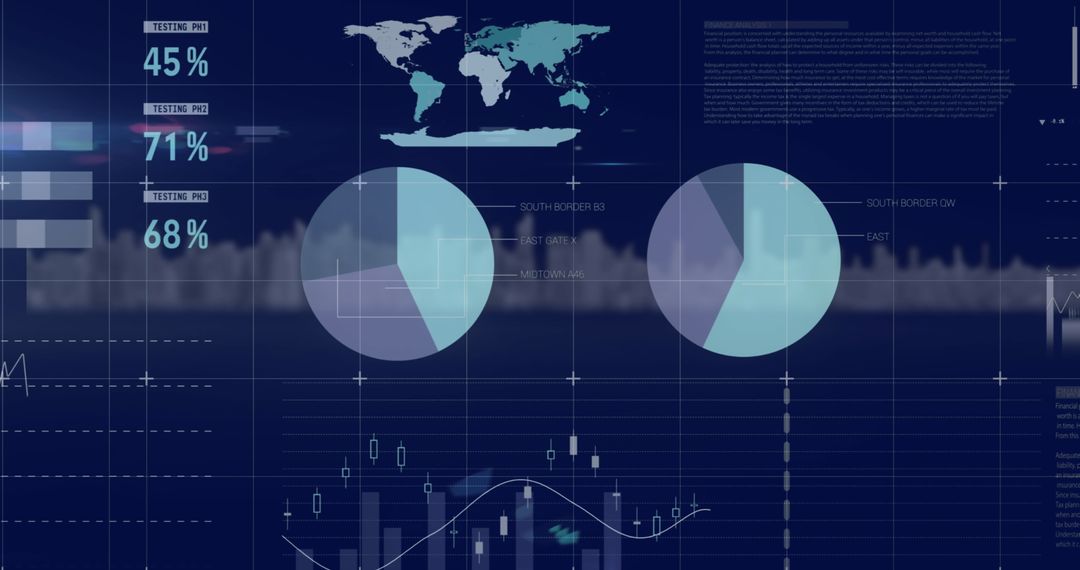
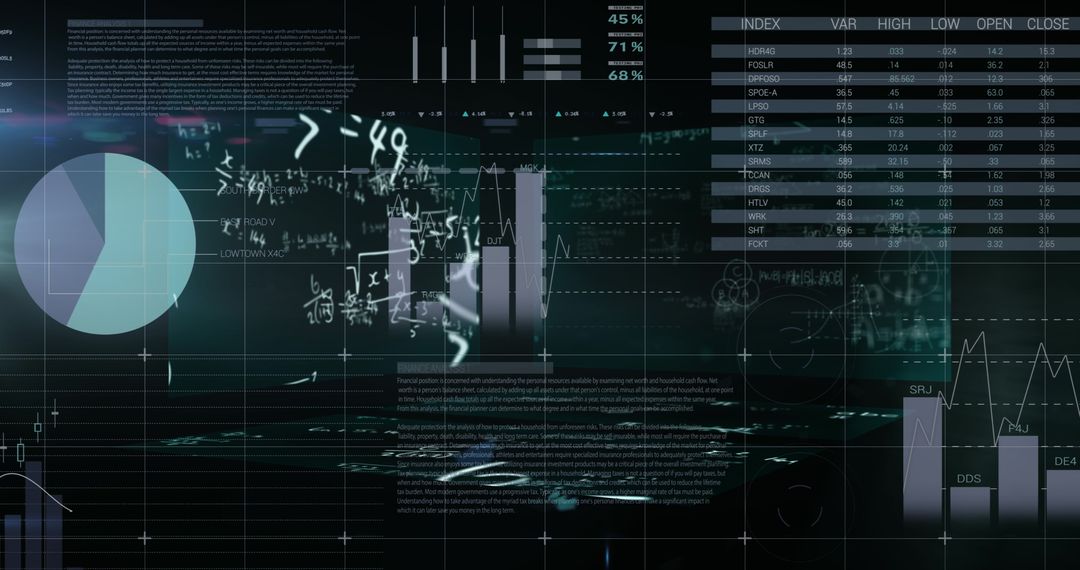
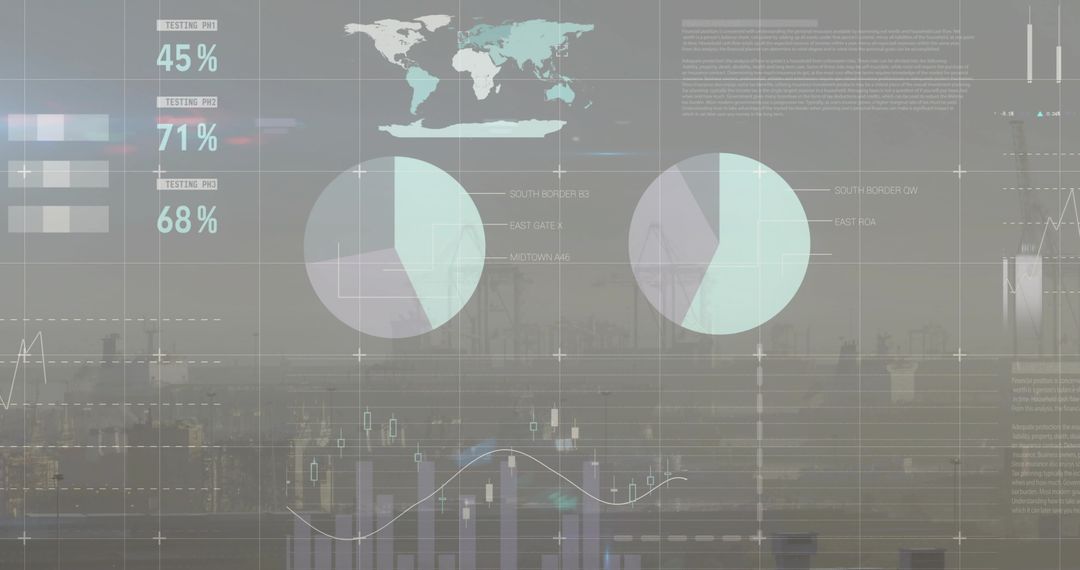
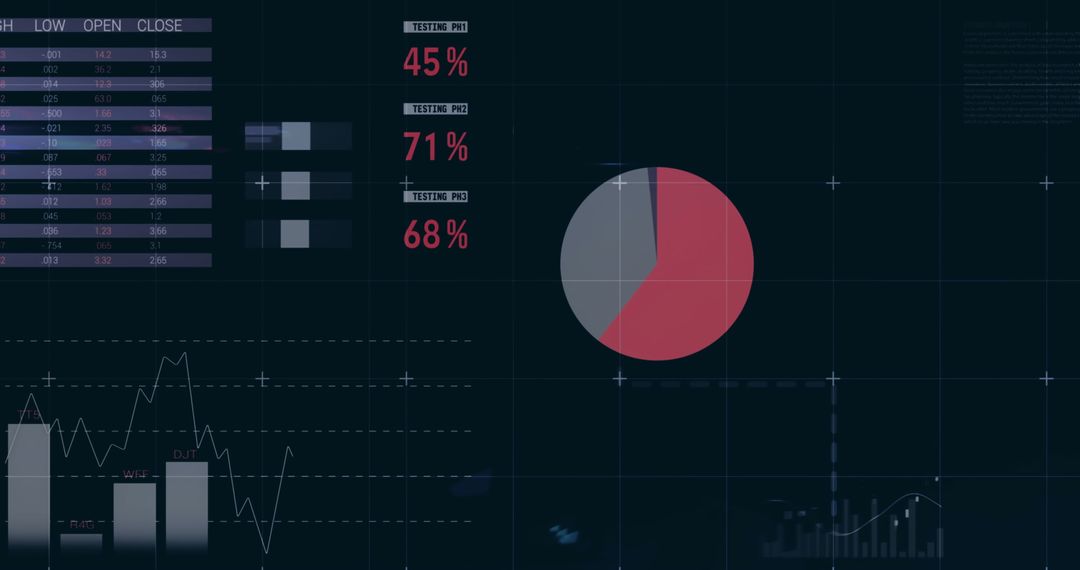
- Digital Interface with Financial Charts and Data Overlaid on Cityscape
Digital Interface with Financial Charts and Data Overlaid on Cityscape Image

Image showcasing digital financial data and analytics overlaid with a futuristic interface in a city setting. Useful for illustrating concepts of global finance, modern business technology, or data analysis in digital marketing and corporate presentation materials.
Powered by  - Get 15% off with code: PIKWIZARD15


0
downloads
downloads
Tags:
More
Credit Photo
If you would like to credit the Photo, here are some ways you can do so
Text Link
photo Link
<span class="text-link">
<span>
<a target="_blank" href=https://pikwizard.com/photo/digital-interface-with-financial-charts-and-data-overlaid-on-cityscape/d5d0102fe5fddbfe450c70270ca179ea/>PikWizard</a>
</span>
</span>
<span class="image-link">
<span
style="margin: 0 0 20px 0; display: inline-block; vertical-align: middle; width: 100%;"
>
<a
target="_blank"
href="https://pikwizard.com/photo/digital-interface-with-financial-charts-and-data-overlaid-on-cityscape/d5d0102fe5fddbfe450c70270ca179ea/"
style="text-decoration: none; font-size: 10px; margin: 0;"
>
<img src="https://pikwizard.com/pw/medium/d5d0102fe5fddbfe450c70270ca179ea.jpg" style="margin: 0; width: 100%;" alt="" />
<p style="font-size: 12px; margin: 0;">PikWizard</p>
</a>
</span>
</span>
Free (free of charge)
Free for personal and commercial use.
Author: People Creations
Similar Free Stock Images
Premium


Premium


Premium


Premium


Premium


Premium


Premium


Premium


Premium


Premium


Premium


Premium


Premium


Premium


Premium


Premium


Premium


Premium


Premium


Premium


Premium


Premium


Premium


Premium