
- Home >
- Stock Photos >
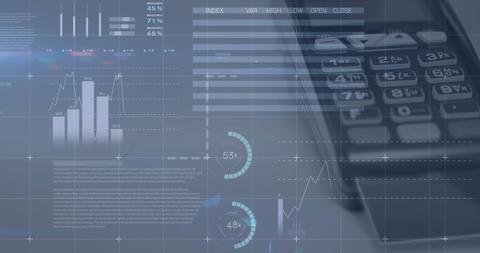
- Digital Interface with Financial Data and Interactive Analytics
Digital Interface with Financial Data and Interactive Analytics Image

Abstract visualization of data overlays statistical charts and graphs on work surface, suggesting modern technology in finance and economics. This dynamic representation is ideal for illustrating technology-driven finance trends, conveying complex data analysis concepts in business presentations, tech blogs, and online financial platforms.
Powered by  - Get 15% off with code: PIKWIZARD15


downloads
Tags:
More
Credit Photo
If you would like to credit the Photo, here are some ways you can do so
Text Link
photo Link
<span class="text-link">
<span>
<a target="_blank" href=https://pikwizard.com/photo/digital-interface-with-financial-data-and-interactive-analytics/bbe00397dc2798f0c5cdc69ad86791e6/>PikWizard</a>
</span>
</span>
<span class="image-link">
<span
style="margin: 0 0 20px 0; display: inline-block; vertical-align: middle; width: 100%;"
>
<a
target="_blank"
href="https://pikwizard.com/photo/digital-interface-with-financial-data-and-interactive-analytics/bbe00397dc2798f0c5cdc69ad86791e6/"
style="text-decoration: none; font-size: 10px; margin: 0;"
>
<img src="https://pikwizard.com/pw/medium/bbe00397dc2798f0c5cdc69ad86791e6.jpg" style="margin: 0; width: 100%;" alt="" />
<p style="font-size: 12px; margin: 0;">PikWizard</p>
</a>
</span>
</span>
Free (free of charge)
Free for personal and commercial use.
Author: Awesome Content
Similar Free Stock Images

Premium


Premium


Premium


Premium


Premium

Premium


Premium


Premium


Premium


Premium


Premium


Premium


Premium


Premium


Premium


Premium


Premium


Premium


Premium


Premium


Premium


Premium


Premium


Premium


Premium


Explore More Free Stock Images