
- Home >
- Stock Photos >
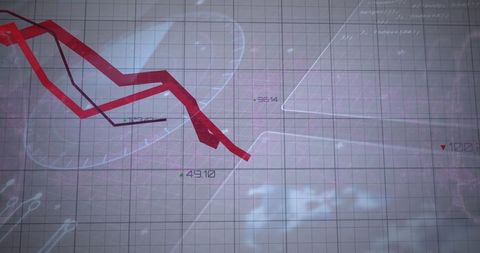
- Digital Interface with Financial Data and Red Declining Graph
Digital Interface with Financial Data and Red Declining Graph Image

Abstract depiction of financial analysis showcasing a red declining graph and various financial data, representing themes of global market decline, economic analysis, and digital finance. Ideal for illustrating articles on economic trends, stock market coverage, business performance, or financial technology advancements in online publications and presentations.
Powered by 


downloads
Tags:
More
Credit Photo
If you would like to credit the Photo, here are some ways you can do so
Text Link
photo Link
<span class="text-link">
<span>
<a target="_blank" href=https://pikwizard.com/photo/digital-interface-with-financial-data-and-red-declining-graph/b922fcde61f735a13f432056dca17a5e/>PikWizard</a>
</span>
</span>
<span class="image-link">
<span
style="margin: 0 0 20px 0; display: inline-block; vertical-align: middle; width: 100%;"
>
<a
target="_blank"
href="https://pikwizard.com/photo/digital-interface-with-financial-data-and-red-declining-graph/b922fcde61f735a13f432056dca17a5e/"
style="text-decoration: none; font-size: 10px; margin: 0;"
>
<img src="https://pikwizard.com/pw/medium/b922fcde61f735a13f432056dca17a5e.jpg" style="margin: 0; width: 100%;" alt="" />
<p style="font-size: 12px; margin: 0;">PikWizard</p>
</a>
</span>
</span>
Free (free of charge)
Free for personal and commercial use.
Author: People Creations
Similar Free Stock Images

Premium


Premium

Premium


Premium


Premium

Premium

Premium


Premium


Premium


Premium


Premium


Premium


Premium

Premium

Premium


Premium


Premium


Premium


Premium

Premium


Premium


Premium


Premium


Premium


Premium

Explore More Free Stock Images