
- Home >
- Stock Photos >
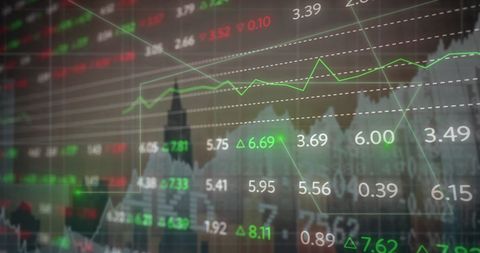
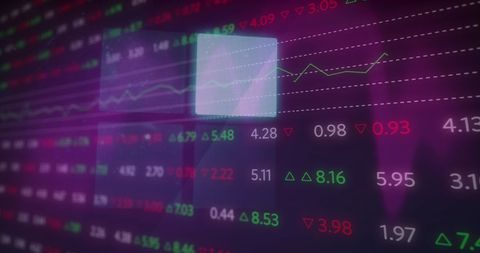
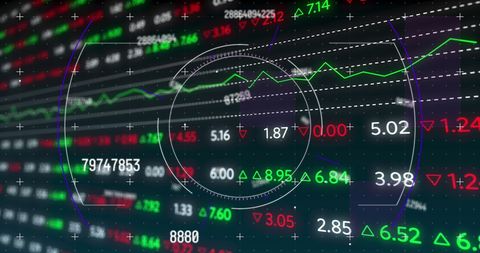
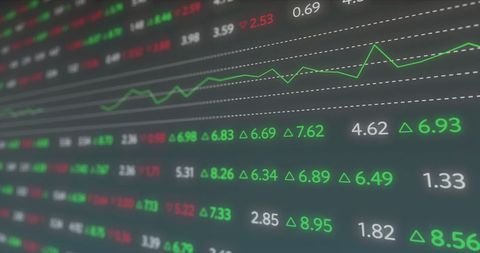
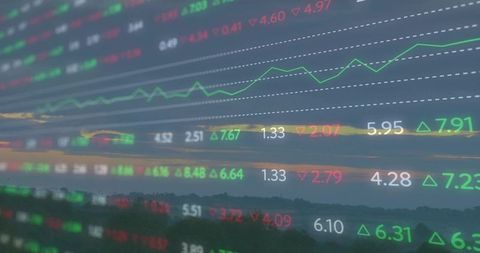
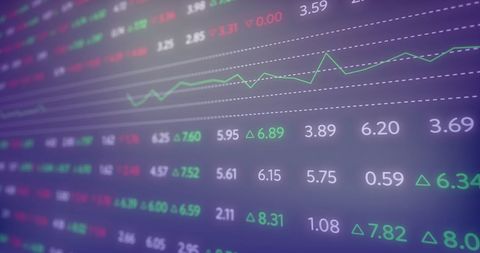
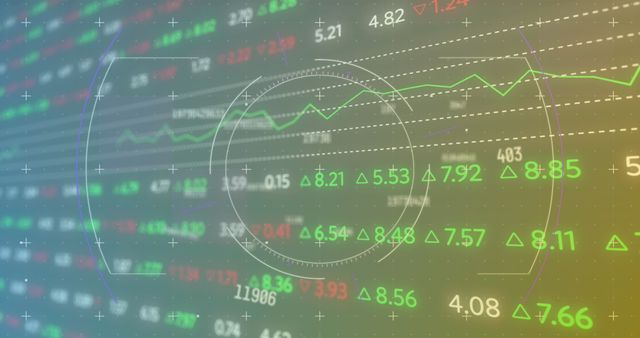
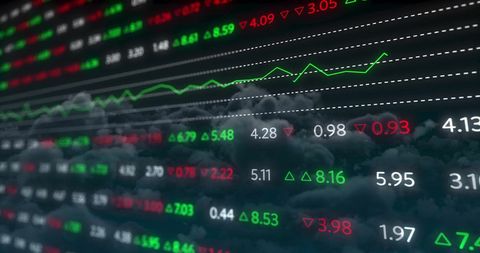
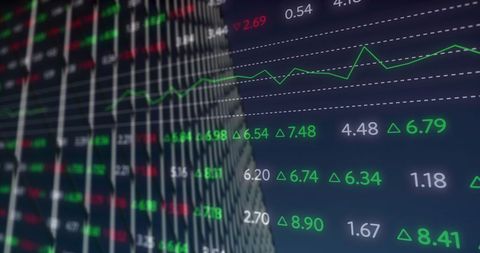
- Digital Interface with Financial Data Displayed on Screen
Digital Interface with Financial Data Displayed on Screen Image

Financial chart displays fluctuating metrics on a transparent digital screen, suggesting movement in global financial markets. Green trends indicate rising stocks, while red numbers denote declining stocks. Widely applicable for articles or media focused on digital analytics, global economy or tutorials introducing stock trading. Suitable for illustrating concepts related to technology's impact on finance.
Powered by  - Get 15% off with code: PIKWIZARD15


downloads
Tags:
More
Credit Photo
If you would like to credit the Photo, here are some ways you can do so
Text Link
photo Link
<span class="text-link">
<span>
<a target="_blank" href=https://pikwizard.com/photo/digital-interface-with-financial-data-displayed-on-screen/b792889b495435954ef9457feedf5f45/>PikWizard</a>
</span>
</span>
<span class="image-link">
<span
style="margin: 0 0 20px 0; display: inline-block; vertical-align: middle; width: 100%;"
>
<a
target="_blank"
href="https://pikwizard.com/photo/digital-interface-with-financial-data-displayed-on-screen/b792889b495435954ef9457feedf5f45/"
style="text-decoration: none; font-size: 10px; margin: 0;"
>
<img src="https://pikwizard.com/pw/medium/b792889b495435954ef9457feedf5f45.jpg" style="margin: 0; width: 100%;" alt="" />
<p style="font-size: 12px; margin: 0;">PikWizard</p>
</a>
</span>
</span>
Free (free of charge)
Free for personal and commercial use.
Author: People Creations
Similar Free Stock Images

Premium


Premium


Premium


Premium


Premium


Premium


Premium


Premium


Premium


Premium


Premium


Premium


Premium

Premium

Premium


Premium


Premium


Premium


Premium

Premium


Premium

Premium


Premium

Premium


Premium


Explore More Free Stock Images