
- Home >
- Stock Photos >
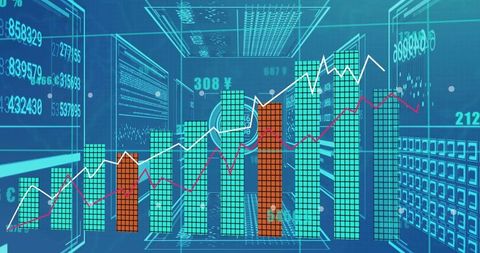
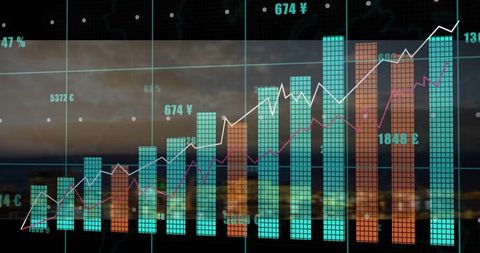
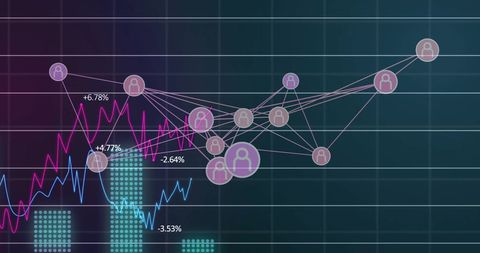
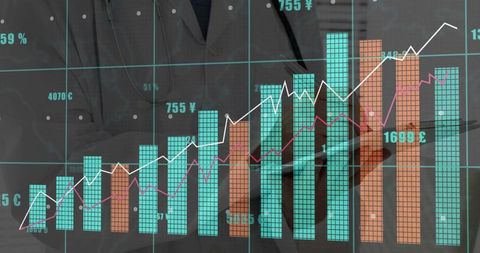
- Digital Interface with Financial Data Projections
Digital Interface with Financial Data Projections Image

Digital workspace vibrant with alternating bar and line graphs showcasing fluctuating financial data, reflecting dynamic movement in stock market. Useful for presentations on digital finance, analytics research, and the global economy.
Powered by 


downloads
Tags:
More
Credit Photo
If you would like to credit the Photo, here are some ways you can do so
Text Link
photo Link
<span class="text-link">
<span>
<a target="_blank" href=https://pikwizard.com/photo/digital-interface-with-financial-data-projections/305b86066c8270a3f75ad189c6f1f5f2/>PikWizard</a>
</span>
</span>
<span class="image-link">
<span
style="margin: 0 0 20px 0; display: inline-block; vertical-align: middle; width: 100%;"
>
<a
target="_blank"
href="https://pikwizard.com/photo/digital-interface-with-financial-data-projections/305b86066c8270a3f75ad189c6f1f5f2/"
style="text-decoration: none; font-size: 10px; margin: 0;"
>
<img src="https://pikwizard.com/pw/medium/305b86066c8270a3f75ad189c6f1f5f2.jpg" style="margin: 0; width: 100%;" alt="" />
<p style="font-size: 12px; margin: 0;">PikWizard</p>
</a>
</span>
</span>
Free (free of charge)
Free for personal and commercial use.
Author: People Creations
Similar Free Stock Images

Premium


Premium


Premium


Premium


Premium


Premium


Premium

Premium


Premium


Premium

Premium


Premium


Premium


Premium


Premium


Premium

Premium


Premium


Premium


Premium

Premium


Premium


Premium

Premium


Premium


Explore More Free Stock Images