1. Home > 
  2. Stock Photos > 
  3. Digital Interface with Financial Data Visualizations

Digital Interface with Financial Data Visualizations Image

Digital Interface with Financial Data Visualizations

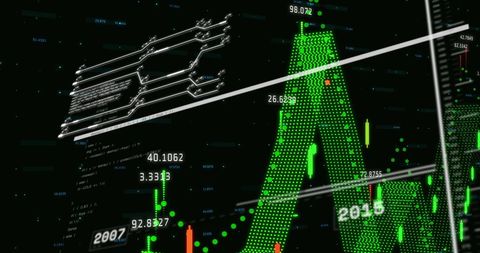
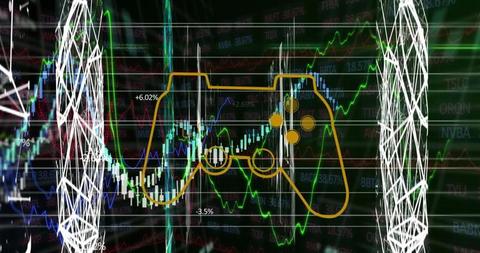
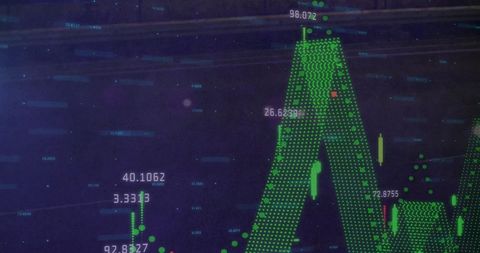
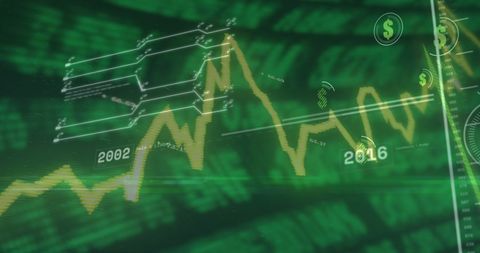
Visual depiction of complex financial data processing against black background, emphasizing glowing green charts and numerical analytics. This visual aligns closely with themes of technology-driven financial markets or investment briefings. Suitable for use in financial analysis presentations, economic forums, and tech-focused business materials that emphasize the intersection of finance and digital innovation.

Powered by Shutterstock logo - Get 15% off with code: PIKWIZARD15
Double exposure image of coin stacks on technology financial graph background.Economy trends background for business ,financial meltdown ,Cryptocurrency digital economy. - Powered by Shutterstock - Get 15% off with code: PIKWIZARD15Online trading, Investment, Strategy market plan, and Stock mark - Powered by Shutterstock - Get 15% off with code: PIKWIZARD15Man look at the dashboard with graphs and charts. Concept of data management system, business intelligence, data statistics, marketing analysis, key performance indicators (KPI) and analytics. - Powered by Shutterstock - Get 15% off with code: PIKWIZARD15Stock trading, crypto currency background. Market Analyze. Bar graphs, Diagrams financial figures - Powered by Shutterstock - Get 15% off with code: PIKWIZARD15Smart businessman hand close up NFT financial data on mobile laptop futuristic stock chart graphic, Business investor stock exchange market and crypto currency data analytics digital technology - Powered by Shutterstock - Get 15% off with code: PIKWIZARD15

Credit Photo

If you would like to credit the Photo, here are some ways you can do so

Free (free of charge)

Free for personal and commercial use.

Author: Awesome Content

Similar Free Stock Images

Colorful Digital Stock Market Graph on Grid Background
Premium
Business man computer hand close up futuristic cyber space finance AI chatbot artificial coding coding background business data analytics programming online network metaverse digital world technology
Abstract Digital Financial Analytics with Data Visualizations
Neon Football Field with Digital Data Visualization
Dynamic Visualization of Financial Markets on Dark Background
Conceptual Digital Stock Market Graphics with Green and Red Patterns
Premium
Business analysis big data screen and economic growth with financial graph. Concept of virtual dashboard technology digital marketing and global economy network connection. 3D illustration.
Dynamic Financial Data Processed Amid City Lights at Night
Digital Wave and Data Patterns in Stock Market Concept
Digital Network Connections Visualization with Data Analysis Graphs
Digital Data Processing with Friends and Bicycles Concept
Premium
Woman hold smartphone use pc at workplace. Project stats financial data sales charts on laptop and cellphone screen, close up view over shoulder. Report preparation, synchronization for safety concept
Financial Data Overlay on Computer Servers Illustrating Global Business Trends
Abstract Digital Finance and Global Economy Data Visualization
Financial Data Overlay on Cityscape Technology Concept
Global Business Data Visualization with Cityscape and World Map
Premium
Man holding blue holographic globe with nodes connected around earth. Concept of global network connection, communication, fintech, data exchange, worldwide exchange of information and online banking.
Abstract Financial Data Processing Visualization in Digital Environment
Colorful Financial Data Analytics and Global Market Trends
Digital Display of Scientific Data and Technological Innovations
Digital Abstract with Growth Analysis Graphics
Premium
Big Data Technology for Business Finance Analytic Concept. Modern graphic interface shows massive information of business sale report, profit chart and stock market trends analysis on screen monitor.
Digital Financial Data Overlay on Modern Office Interior
Global Financial Data Display on World Map Background
Dynamic Coding Over Data Server Room Concept
Dynamic Financial Statistics with Cityscape Overlay
Premium
Picture female hand touching modern tablet.Investment manager working new private banking project office.Using electronic device.Graphic icons,worldwide stock exchanges interface on screen. Horizontal
Data Processing and Analytics on Global Finance Map
Abstract Digital Data Visualization and Analysis Background
Digital Financial Data Displayed Over Retail Shelves
3D Green Bars and Line Graph on Dark Grid Background for Data Visualization
3D Stock Market Graph in Digital Display
Digital Green Financial Markets with Cryptocurrency Trends
Premium
Man look at the dashboard with graphs and charts. Concept of data management system, business intelligence, data statistics, marketing analysis, key performance indicators (KPI) and analytics.
Digital Composite of Football Field and Data Visualization Charts
Digital Financial Data Display with Graphs and Metrics
Dynamic Financial Data Chart with Green Line Graph
Digital Graphics Depicting Currency Symbols with Stock Market Data
Premium
Hand pointing to financial data and market growth graphic report on screen
Global Financial Data Overlay with Vibrant Graphs on World Map
Digital Data Visualization with Dynamic Stock Market Charts
Digital Data Processing and Connectivity Interface
Construction Site Merging with Financial Data Stream
Premium
Businessperson working with AI-powered financial data analysis tools, showcasing advanced technology in finance. Ideal for fintech, AI research, and technology
Abstract Game Controller with Stock Market Graph
Digital Financial Data Visualization with Graphs and Charts
Advanced Financial Data Dashboard with Dynamic Graphs and Metrics
Digital Financial Graph and Programming Concepts
Premium
Financial technology concept. Stock chart. Investment. Fintech.
Futuristic 3D Graph Illustration with Data Overlay
Futuristic Data Graph with Digital Interface Elements
Digital Financial Data Processing Against Black Background
Futuristic Data Analytics with Virtual Graph over Digital Grid
Premium
Business man using computer hand close up futuristic cyber space decentralized finance coding background, business data analytics programming online VPN network metaverse digital world technology
Abstract Neon Data Tunnel with Dynamic Numbers Overlay
Digital Financial Data Analytics Chart Performance
Financial Data Analytics on Neon Black Grid Background
Rising Data Graph Over Digital Servers in Futuristic Environment
Premium
Big Data Technology for Business Finance Analytic Concept. Modern graphic interface shows massive information of business sale report, profit chart and stock market trends analysis on screen monitor.
Global Financial Data Network with Digital Connections
Abstract Financial Data with Green Digital Background
Analytical Dashboard with Candlestick Chart and Dotted Trend Line
Futuristic Digital Interface with Market Analysis
Digital Data and Cloud Computing with Green Light Effects
Digital Financial Data Processing on Notepad Screen
Premium
Man technology future lifestyle, digital marketing IOT internet of thing future AI chatbot technology smart device social network, VPN cybersecurity internet futuristic metaverse NFT background
Abstract Digital Interface with Glowing Data Metrics
Futuristic Financial Graphs with Dynamic Green Line
Global Financial Analysis Over Neon Cityscape
Colorful Graph Displaying Stock Market Trends on Digital Grid
Premium
Futuristic Digital Growth Chart – 3D Bar Graph with Glowing Blue Data Visualization
Financial Data Processing Over Urban Cityscape Night View
Financial Data Visualization Over Construction Site
Concept of Financial Data Analysis with Digital Elements
Digital Data Processing on Global Technological Interface
Premium
Showing digital market display scrolling stock symbols on dark grid, with yellow line graphs. Financial technology, data visualization, stock market analysis, trading platform, digital interface,
Digital Data With Eco Icons Highlighting Environmental Impact
Digital Notifications and Holographic Data Visualization
Digital Data Network with Financial and Business Icons
Futuristic Digital Data Visualization with Holographic Interface
Premium
Businessman pointing chart financial goals and economic business planning global.
Financial Data Analysis Overlaying Cityscape
Financial Statistics Overlay in Modern Office Interior
Dynamic Financial Data and Technology Visualization
Digital Network Connections with Financial Icons on Virtual Display
Premium
Dark blue grid filling screen when green bars rising while candlestick line animating marking peaks. Analytics, finance, data visualization, dashboard, digital interface, stock market, performance
Financial Data Visualization with Binary Coding in Green-Blue Palette
Financial Data Processing Code Over Digital Graph
Dynamic Digital Data Analysis in Finance
Digital Data Mapping and Global Connectivity Insights
Premium
Business analysis big data screen and economic growth with financial graph. Concept of virtual dashboard technology digital marketing and global economy network connection. 3D illustration.
3D Green Bar Peak in Futuristic Digital Interface
Displaying Neon 3D Dotted Financial Chart with Candlesticks, Numeric Labels, Analytics
Digital Financial Data Analysis with Graphs
Digital Financial Data on Black Background with Graphs
Digital Financial Data and Market Analytics Concept
Digital Financial Graphs and Data in Motion
Premium
Persons Hand Holding Tablet Digital Financial Graph Analysis, Upward Chart Showing Growth, Business Interface, Stock Market Data, Smartphone Interaction
Digital Finance Interface with Data Processing Elements
Dynamic Financial Data with Abstract Stock Market Graphs
Advanced Digital Graph Illustrating Stock Market Trends
Digital Network with Connected Icons and Data Streams
Premium
Man Typing Keyboard Laptop Hand.Project Manager Researching Process.Business Team Working Startup modern Office.Global Strategy Virtual Icon.Innovation Graphs Interfaces.Analyze market stock.Blurred
Financial Data Visualization Against City Skyline
Digital Interface Showing Data Protection and Financial Trends
Futuristic Digital Data Processing and Analysis Concept
Graph Icons Hologram with Social Media Notifications
Premium
A professional businessman showcases stock market data through a digital interface, set against a modern city backdrop, emphasizing the importance of financial analysis in investment strategies.
Dynamic Financial Data with Graph Trends and Statistics
Futuristic Financial Data and Analytics Pathway
Abstract Network Connections with Financial Data Overlay
Digital Interface Showing Scientific Data Processing
Premium
Businessman using futuristic user interface with virtual data analytics. Innovative dashboard with financial charts, graphs, and global network information for business intelligence.
Digital Stock Market Data with Fluctuating Numbers and Graphs
Dynamic Financial Data Visualization on Blue Background
Advanced Financial Data Network Over World Map
Neon Tunnel Visualizing Dynamic Data in Futuristic Interface
Premium
Multi exposure of virtual abstract financial graph interface on modern interior background, financial and trading concept
Dynamic Financial Data Projection in Modern Office Environment
Abstract Stock Market Graph with Digital Data Animation
Dynamic Chart with Green Bar Graph and Growing Trendline
Digital Interface Overlaid on Retail Environments Reflecting Market Data
Premium
Displaying green bars red trend line, candlestick-line charts on world map in grid terminal display. Financial technology, data visualization, digital interface, stock market, global analytics,
Global analytics dashboard displaying uptrend line graph over dotted world map with neon HUD