
- Home >
- Stock Photos >
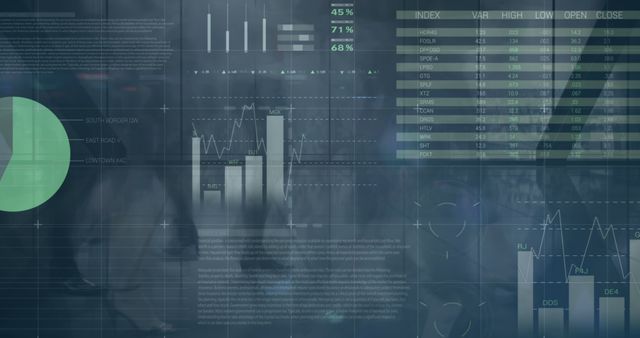
- Digital Interface with Financial Graphs and Analytics
Digital Interface with Financial Graphs and Analytics Image

This image depicts a digital interface showcasing financial graphs and various data analytics, overlaying the figure of a woman. It evokes a sense of modern technology, perfect for use in presentations about financial strategy, data analysis tools, or technological innovation in business. Highlighting data-driven decision-making, it could be used in blog posts or articles discussing advancements in technology or global market trends.
Powered by 


downloads
Tags:
More
Credit Photo
If you would like to credit the Photo, here are some ways you can do so
Text Link
photo Link
<span class="text-link">
<span>
<a target="_blank" href=https://pikwizard.com/photo/digital-interface-with-financial-graphs-and-analytics/b69128da584f4427e01240e5fd4b99b2/>PikWizard</a>
</span>
</span>
<span class="image-link">
<span
style="margin: 0 0 20px 0; display: inline-block; vertical-align: middle; width: 100%;"
>
<a
target="_blank"
href="https://pikwizard.com/photo/digital-interface-with-financial-graphs-and-analytics/b69128da584f4427e01240e5fd4b99b2/"
style="text-decoration: none; font-size: 10px; margin: 0;"
>
<img src="https://pikwizard.com/pw/medium/b69128da584f4427e01240e5fd4b99b2.jpg" style="margin: 0; width: 100%;" alt="" />
<p style="font-size: 12px; margin: 0;">PikWizard</p>
</a>
</span>
</span>
Free (free of charge)
Free for personal and commercial use.
Author: Authentic Images
Similar Free Stock Images

Premium


Premium

Premium


Premium


Premium


Premium


Premium

Premium


Premium


Premium


Premium

Premium


Premium

Premium


Premium

Premium

Premium


Premium


Premium


Premium


Premium


Premium


Premium


Premium


Premium

Explore More Free Stock Images