1. Home > 
  2. Stock Photos > 
  3. Digital Interface with Graphs and Charts for Data Analysis

Digital Interface with Graphs and Charts for Data Analysis Image

Digital Interface with Graphs and Charts for Data Analysis

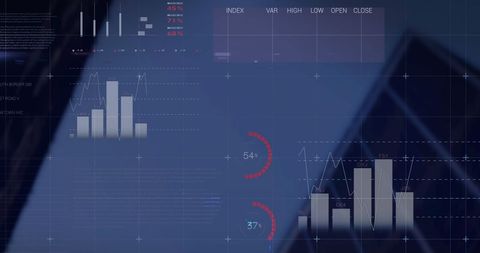
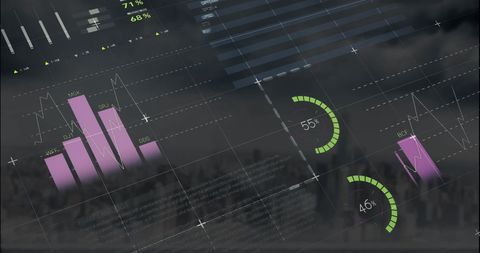
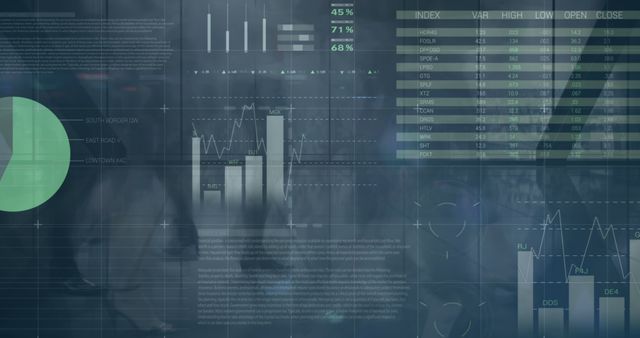
Visual of advanced digital interface with graphs and charts in futuristic design. Useful for financial analysis presentations, tech company marketing, educational resources on data processing, or illustrating modern communication in global networks.

Powered by Shutterstock logo - Get 15% off with code: PIKWIZARD15
AI, Big Data, and business analytics icons represent the integration of advanced technology in analyzing graphs, business data, and market trends, driving strategic decisions and innovative solutions. - Powered by Shutterstock - Get 15% off with code: PIKWIZARD15Big data technology and data science with person touching data flowing on virtual screen. Business analytics, artificial intelligence, machine learning. Engineer or scientist analyzing stream of data. - Powered by Shutterstock - Get 15% off with code: PIKWIZARD15Desktop Computer Monitor with Finance Statistical Data Software and Progressive User Interface Standing on the Desk in the Modern Business Office. In the Background Glass Wall with Big City Office. - Powered by Shutterstock - Get 15% off with code: PIKWIZARD15Analyst working with Business Analytics and Data Management System on computer to make report with KPI and metrics connected to database. Corporate strategy for finance, operations, sales, marketing - Powered by Shutterstock - Get 15% off with code: PIKWIZARD15Analyzing Key Performance Indicators. Businessman using digital screen to analyze key performance indicators (KPI) with various graphs and charts, showcasing data analysis and performance tracking. - Powered by Shutterstock - Get 15% off with code: PIKWIZARD15

Credit Photo

If you would like to credit the Photo, here are some ways you can do so

Free (free of charge)

Free for personal and commercial use.

Author: Authentic Images

Similar Free Stock Images

Digital Business Graphs with Cityscape Background Overlay
Premium
Professional woman interacting with digital sales dashboard displaying various charts and graphs in modern office
Abstract Financial and Statistical Data Visualization on Screen
Futuristic Blue Data Analytics Interface with Graphs and Statistics
Dynamic Data Visualization Overlaying Urban Cityscape
Holographic Financial Data and Code Overlays
Premium
Data Science and engineering, digital technology, tech background. Software engineer working with database and big data analytics, cloud computing with AI and data exchange, innovation technology
Advanced Data Interface with Stock Market Analytics Graphics
Abstract Digital Data Interface on Blue Background
Modern Financial Data Charts with Futuristic Interface
Financial Data Analytics Concepts on Urban Cityscape Background
Premium
Digital transformation concept. System engineering. Binary code. Programming.
Abstract Digital Data Processing with Urban Landscape Background
Digital Infographic Interface with Data Visualization Elements
Financial Data Processing with Graphical Analysis Interface
Infographic Interface Overlapping City Skyscrapers
Premium
Python Programming Web Development Coding Concept.Software development concepts and programming for various devices, Software Engineer Computer programming, coding process, chart, and Data analytics.
Financial Data Analysis with Cybersecurity Overlay and Code Elements
High Tech Financial Data Visualization with Analytics
Futuristic Infographic Interface with Cityscape Background
Futuristic Digital Interface Overlaying Cityscape
Premium
Business man computer hand close up futuristic cyber space finance AI chatbot artificial coding coding background business data analytics programming online network metaverse digital world technology
Futuristic Digital Dashboard with Financial Data Analysis
Financial Data and Analytics Visualization in Digital Interface
Futuristic Data Interface with Graphs and Charts
Digital Finance Elements Over Urban Skyline
Premium
Scientist working with business data, finance, marketing report, Big Data Analytics technology, Processing Complexity information flow on virtual screen, machine learning, artificial intelligence, ML
Global Business Analytics and Data Visualization Interfaces
Tech-Savvy Data Processing High Score Concept
Futuristic HUD with Graphs and Progress Indicators on Highrise
Futuristic Data Visualization Dashboard with Bar Charts and Gauges
Futuristic Digital Cityscape with Analytics and Data Visualization
Futuristic Data Visualization with Graphs and Analytics Interface
Premium
Big data technology and data science. Data scientist querying, analysing and visualizing complex set on virtual screen. Data flow concept. Neural network, artificial intelligence, ML, analytics.
Futuristic Data Analysis Dashboard with Graphs
Financial Data Visualization with Interactive Graphs and Charts
Futuristic Digital Interface Displaying Statistics and Graphs
Digital Data Analytics Framework Over Urban Cityscape
Premium
Businessman analysis enterprise data management by AI artificial intelligence technology. Business analytics dashboard charts, metrics, KPI to improve, insight report for operation. Analyst marketing,
Digital Interface with Data Visuals for Technology Concepts
Financial Data Overlay on Business Motion Blur
Digital Interface with Global Social Media Analytics and Data Visualization
Futuristic Digital Interface Overlays on Cityscape Background
Premium
Business finance data analytics graph.Financial management technology.Advisor using KPI Dashboard on virtual screen.
Futuristic Finance Data Processing on Digital Display
Digital Infographic Overlay on Cityscape Illustrating Market Trends
Digital Infographic Interface Over City Architecture Background
Infographic Interface Overlay on City Skyline Visualizing Data
Premium
AI, Big Data, and business analytics icons represent the integration of advanced technology in analyzing graphs, business data, and market trends, driving strategic decisions and innovative solutions.
Infographic Interface Overlay on Aerial Cityscape Conveys Business Growth
Futuristic Multicolored Infographic Interface Over Cityscape
Advanced Data Processing Over Modern Cityscape Concept
Data Analysis and Technology Screens with Mathematical Equations
Premium
Human and technology concept. Digital transformation. AI (Artificial Intelligence). Wide image for banners, advertisements.
Digital Analytics Across Skyscraper Background
Global Data Visualization with Interactive Digital Interface
Global Finance Data Visualization with Charts and Numerical Insights
Digital Financial Interface Overlaying Modern Urban Cityscape
Premium
Business meeting with hands on documents, charts, and graphs. Focus on data analysis, strategy, and teamwork. Professional setting data analysis meeting with digital overlay.
Holographic Data Visualization in Futuristic Urban Environment
Futuristic Data Analytics Overlay on City Street Night View
Innovative Digital Dashboard with Data Analytics Visualizations
Advanced Digital Interface with Data Analytics Overlaid on Network
Overlay of Graphs and Compass on African Map
Digital Financial Data Dashboard with Bar and Line Graphs
Premium
Young femal e engineer concept. GUI (Graphical User Interface).
Digital Representation of Financial Analytics with Graphs and Charts
Futuristic Data Overlay on Cityscape for Global Digital Business
Digital Data Interface Overlay on Landscape Background
Futuristic Data Visualization in Dark Interface Design
Premium
Businessman using tablet Analytics Data KPI Dashboard Tech with charts, metrics, and KPI to analyze performance and create insight reports for operations management.Data mining.Data analysis.Ai
Financial Data Analytics Over Cityscape with Digital Graphics
Dynamic Data Analysis Amidst Futuristic Server Environment
Digital Financial Data Interface with Business Analytics
Futuristic Financial Analytics with Digital Charts and Graphs
Premium
Hand holding smartphone displays data visualizations, including histogram and pie chart. Analytics, digital transformation and increasing use of mobile technology in business. Minimalist art collage.
Digital Infographic Interface with Modern Cityscape Background
Futuristic Infographic Interface Overlay on Modern Cityscape
Futuristic Data Processing with Graphs and Charts Overlay
Infographic Interface over Cityscape with Financial Data and Statistics
Premium
A hand pointing at a digital cybersecurity interface with a lock icon, futuristic graphic style on a dark background. Concept of cybersecurity and data protection
Futuristic Infographic Interface Overlaying Urban Cityscape
Digital Data Processing and Network Visualization Concept
Statistical Data Processing and Analysis on Blue Background
Modern Business Infographics Against Urban Skyline
Premium
Strategic Planning and Analysis in Business Project Management
Abstract Financial Data Analysis on Global Business Background
Digital Financial Data Analytics and Cityscape Technology Integration
Financial Data Visualizations Merging with Urban Night Skyline
Celebratory You Win Screen Amid Digital Background
Premium
Business process and strategy on virtual screen. Data analysis. Workflow.
Futuristic Data Dashboard With Glowing Analytics Display
Visualizing Futuristic Data Dashboard Showing Interactive Analytics and Financial Trends
Interactive Data Analysis with Graphs and Equations
Abstract Digital Data Interface on Green Background
Data Processing and Statistics Overlaid on Computer Servers
Ruble Symbol Against Digital Data and Global Business Interface
Premium
Doctor Utilizing Advanced Digital Tablet Technology in Modern Healthcare. Medical Professional in Operating Room Analyzing Real-Time Patient Data, Cutting-Edge Medical Innovations and solutions.
Business Analytics Technology Over Cityscape Conceptual
Digital Data Analytics Interface Overlaid on Scenic Landscape
Digital Data Visualization with Futuristic Analytics Interface
Futuristic Digital Data Processing with Charts and Graphs Overlay
Premium
Man look at the dashboard with graphs and charts. Concept of data management system, business intelligence, data statistics, marketing analysis, key performance indicators (KPI) and analytics.
Global Finance Digital Interface with Business People and Data Graphics
Digital Interface Displaying Financial Data and Graphs
Digital Holographic Infographic Display with Charts and Data
Dynamic Holographic Financial Dashboard with Graphs and Charts
Premium
Business finance data analytics graph.Financial management technology.Advisor using KPI Dashboard on virtual screen.
Abstract Infographic Overlay on Modern Architectural Background
Digital Analytics Interface with Dynamic Charts and Social Media Icons
Digital Financial Data Visualization with Abstract Cityscape
Futuristic Infographic Interface Over Modern Cityscape at Dawn
Premium
Online trading, Investment, Strategy market plan, and Stock mark
Digital Financial Data Visualization with Dynamic Graphs
Abstract Digital Data Analytics and Visualization
Digital Infographic Overlaid on Modern Architecture
Night Cityscape with Animated Business Data Overlay
Premium
Businessman using futuristic user interface with virtual data analytics. Innovative dashboard with financial charts, graphs, and global network information for business intelligence.
Digital Interface with Financial Graphs and Analytics
Digital Financial Analytics With Urban Backdrop
Futuristic Data Start Screen with Hexagonal Grid
Innovative Digital Dashboard Showing Data Analytics
Premium
Analytics Finance and Business concept. Big data analytics and business intelligence BI.
Blue Financial Analytics Dashboard Displaying Charts, Gauges and Urban Glass Reflection